
Figure 1.
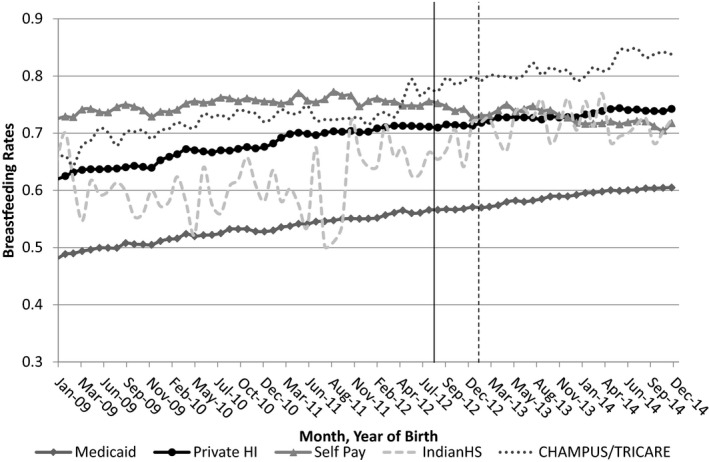
Trends in Breastfeeding Rates, by Source of Payment (for Delivery)
- Notes: 2009–2014 NVSS Births data. Vertical lines represent the legislative implementation (August 2012) and likely effective implementation at the modal plan start month (January 2013) dates. N = 24,005,896 births.