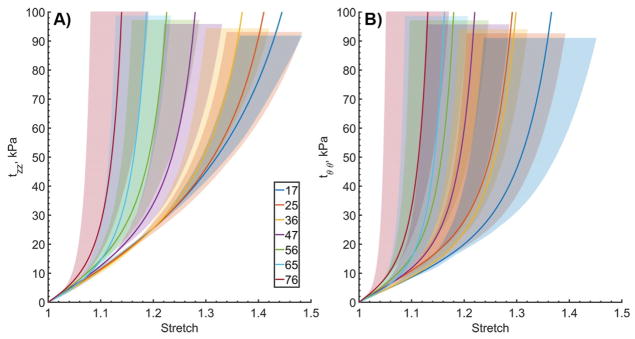
Figure 1.
Ranges of (A) longitudinal and (B) circumferential equibiaxial Cauchy stresses plotted against longitudinal and circumferential stretch in all seven age groups. Age groups are represented by different colors. Solid lines demonstrate average stress-stretch response per group, and legend summarizes average ages (years). Shaded semi-transparent regions show 25th and 75th percentile ranges, they have different heights for better visual representation.

