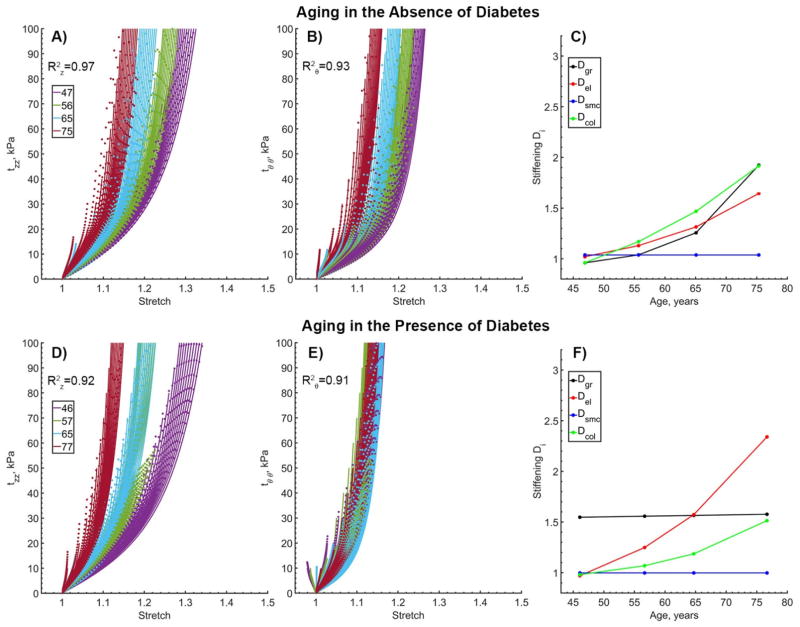
Figure 5.
Changes in longitudinal (z) and circumferential (θ) Cauchy stress – stretch relations (A,B,D,E) with age and stiffening functions (C,F) for subjects without (panels A–C) and with (panels D–F) diabetes. Model fits are presented with dotted lines while data are plotted using solid lines. Multiple curves of the same color represent different loading protocols with different loading-ratios. R2 values are provided to demonstrate the quality of fit for all protocols and all age groups. Note the overall stiffer behavior of diabetic arteries in the circumferential direction and clustering of the curves around the oldest age group. Constitutive and stiffening parameters that were used to generate these graphs are summarized in Table 3, second and third columns.

