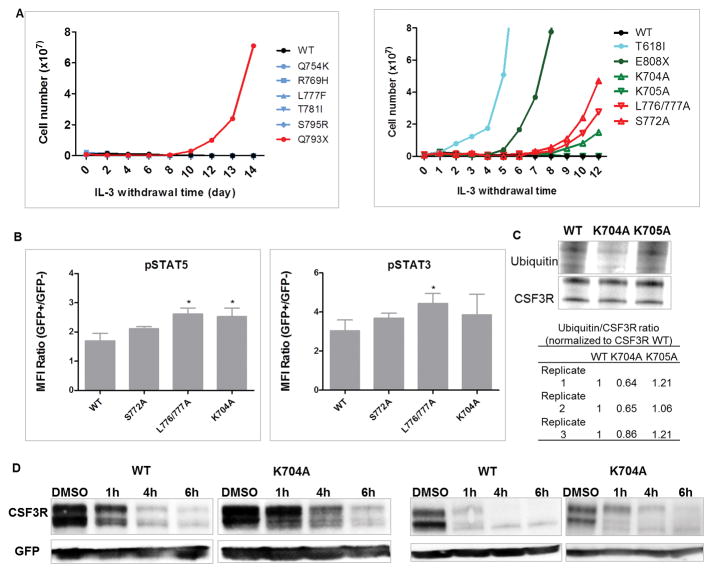
Figure 4. CSF3R missense mutations seen in AML patients do not demonstrate leukemogenic potential; K704A is leukemogenic.
(A) Representative transforming assays of Ba/F3 cells expressing CSF3R missense mutations (left) seen in patients or (right) at potential functional residues. (B) Transduced Ba/F3 cells were serum starved for 90min and stimulated with 10ng/ml G-CSF for 90min. Graph depicts pSTAT5 and pSTAT3 MFI ratio of GFP+ transduced cells/GFP- non-transduced cells determined by phosphoflow. (C) Representative co-IP image demonstrates reduced ubiquitin binding in K704A cells. Table (lower panel) shows three replicates of K704A ubiquitin/CSF3R ratios normalized to CSF3R WT determined by integrated density quantification. K705A was used as a negative control. (D) Representative immunoblot images showing CSF3R expression in (left panel) HEK293T/17 and (right panel) NIH3T3 cells transient transfected with WT or K704A after a time course CHX treatment. Data and images shown are representative of three or more independent experiments. Statistical significance was assessed using a two tailed Student’s t-test: * p<.05.

