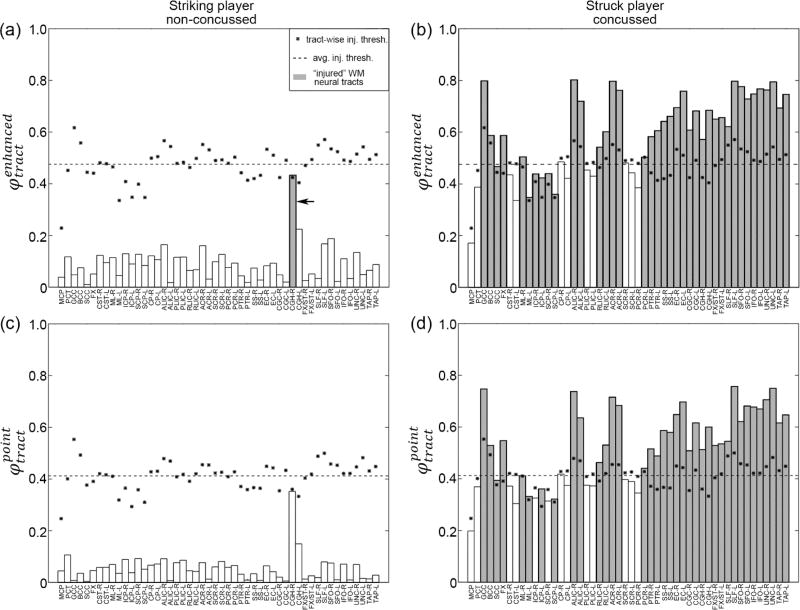
Fig. 13.
Illustration of injury susceptibilities using (top) and (bottom) for the same pair of athletes. Stars/dashed lines represent tract-wise/average injury thresholds at a 50% probability for concussion. Potentially “injured” tracts (i.e., susceptibilities exceeding the corresponding tract-wise thresholds) are highlighted in gray. Even for the un-concussed athlete, in CGH-R still exceeded its tract-wise threshold (arrow).

