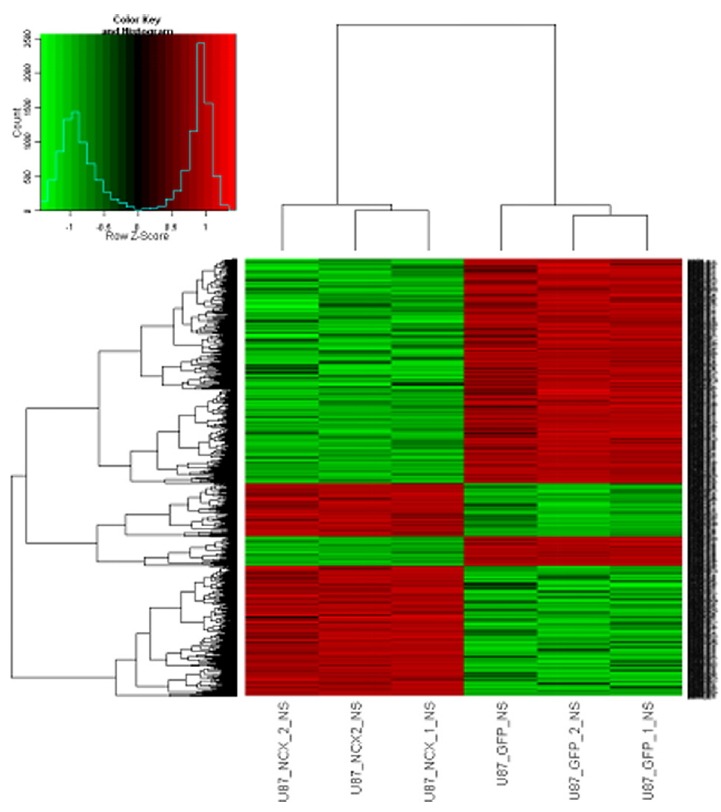
Fig. 7. The heatmap for cluster analysis of differentially expressed genes.

The fold change in gene expression levels between U87-NC and U87-SLC8A2 cells. Fold change>2.0, P < 0.01. Red, up-regulation of gene expression; Green, down-regulation of gene expression.
