Fig. 3.
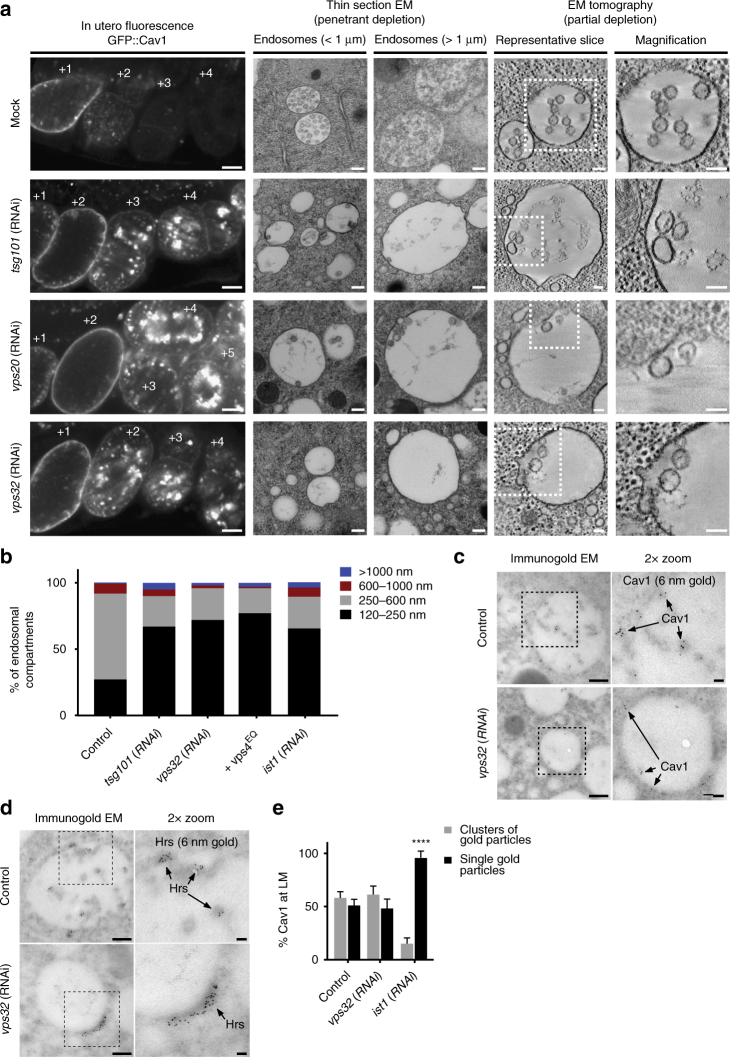
ESCRT-III is required for membrane deformation and cargo retention on MVEs in vivo. a Control (n = 35, mock-treated animals) and RNAi-treated animals (n = 12, Tsg101 depleted animals; n = 11, Vps20 depleted animals; n = 35, Vps32-depleted animals) expressing GFP::Cav1 were imaged using fluorescence (left panels) and electron microscopy in utero. The effects of penetrant ESCRT subunit depletion were analyzed by thin-section electron microscopy (middle panels; n = 54, mock-treated animals; n = 77, Tsg101 depleted animals; n = 63, Vps20 depleted animals; n = 74, Vps32-depleted animals), and partial depletions were conducted to enable ILV formation, which was examined by electron tomography (right panels; n = 118, mock-treated; n = 15, Tsg101 depletion; n = 10, Vps20 depletion; n = 32, Vps32 depletion). Representative images are shown. Bars, 10 μm (left panels, fluorescence imaging), 200 nm (middle panels, thin-section EM), and 100 nm (right panels, tomographic slices). b The size distribution of endosomal compartments in the one-cell stage embryo was determined for control animals (n = 86), ESCRT subunit depleted animals (n = 212, Tsg101 depleted animals; n = 77, Vps32-depleted animals; n = 110, Ist1-depleted animals), and transgenic animals expressing Vps4E219Q (n = 112). c The distribution of Cav1 at endosomes was determined by immunogold labeling in control (n = 122) and Vps32-depleted one-cell stage embryos (n = 40). Micrographs shown are representative of the endosomal compartments analyzed for each condition. Bars, 200 nm (left panels) and 50 nm (right, zoomed panels). d The distribution of Hrs (ESCRT-0) at endosomes was determined by immunogold labeling in control (n = 42) and Vps32-depleted one-cell stage embryos (n = 36). Micrographs shown are representative of the endosomal compartments analyzed for each condition. Bars, 200 nm (left panels) and 50 nm (right, zoomed panels). e Quantification of Cav1 distribution in control (n = 37) and ESCRT-III subunit depleted embryos (n = 25, Vps32 depletion; n = 33, Ist1 depletion) was determined using immunogold labeling, as described in panel 1 f. Standard error of the mean is shown in each case. ****p < 0.0001, using a two-way ANOVA with Dunnett’s test

