Fig. 4.
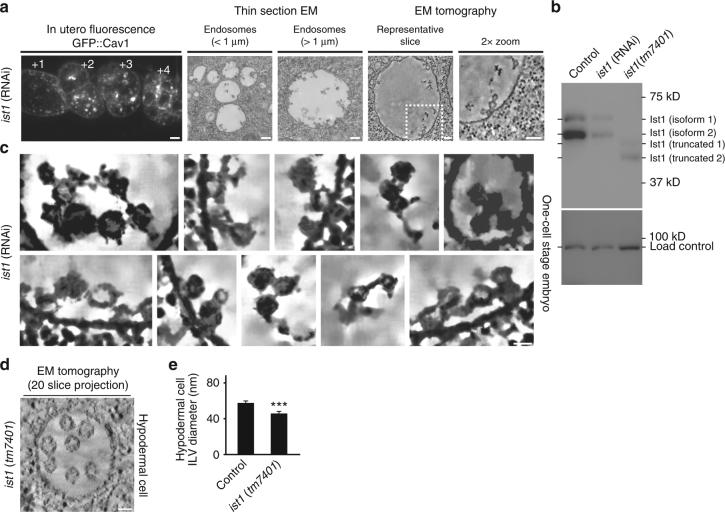
Ist1 regulates MVE biogenesis. a Animals expressing GFP::Cav1 were depleted of Ist1 using RNAi and imaged using fluorescence (left panels; n = 20 animals) and electron microscopy. Both thin-section electron microscopy (middle panels; 313 MVEs analyzed) and electron tomography (right panels; n = 13 MVEs analyzed) were conducted to visualize MVE and ILV morphology. Representative images are shown. Bars, 10 μm (left panels, fluorescence imaging), 200 nm (middle panels, thin-section EM), and 100 nm (right panels, tomographic slices). b Extracts were generated from control, Ist1-depleted and ist1 (tm7401) mutant animals and separated by SDS–PAGE, followed by immunoblot analysis using antibodies directed against Ist1. Two splice variants have been identified for Ist1, each of which was detected. c Regions extracted from several tomograms described in panel a were processed for noise reduction and feature enhancement. Bar, 25 nm. d Representative MVE found in a hypodermal cell (n = 12) from an animal harboring the ist1 (tm7401) mutation imaged using electron tomography. Bar, 50 nm. e Quantification of ILV diameter found in control and ist1 (tm7401) hypodermal cells. Standard error of the mean is reported in each case. ***p < 0.001, using a t-test

