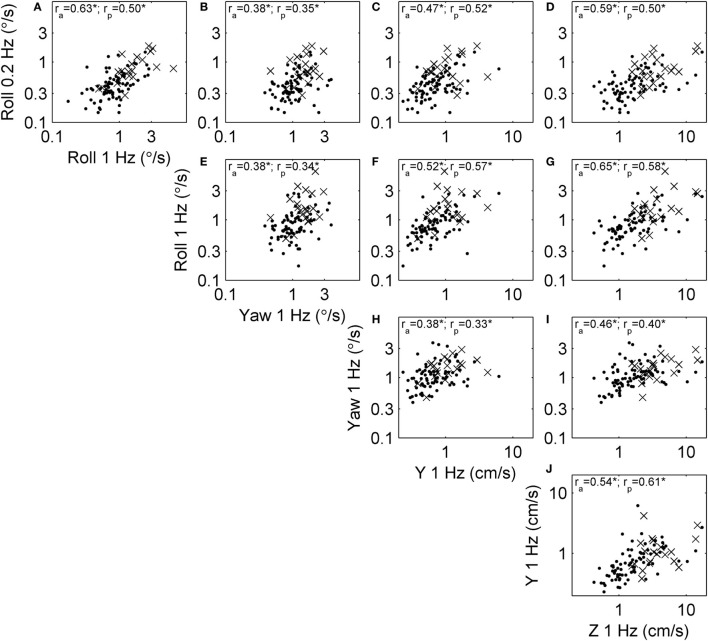
Figure 3.
Scatterplots showing the relationship between each of the threshold measures across subjects. Each subject is shown, and segmented into those who passed (dots) and failed (×) condition 4 of the balance test. Correlation coefficients were calculated using log-transformed thresholds, including the correlation across all subjects (ra) and only those who passed condition 4 (rp). All correlations were significant at the p < 0.005 level (indicated by *). (A) The relationship between roll tilt 0.2 Hz thresholds and roll tilt 1 Hz thresholds across subjects. (B–J) The relationships between other corresponding pairs of thresholds.

