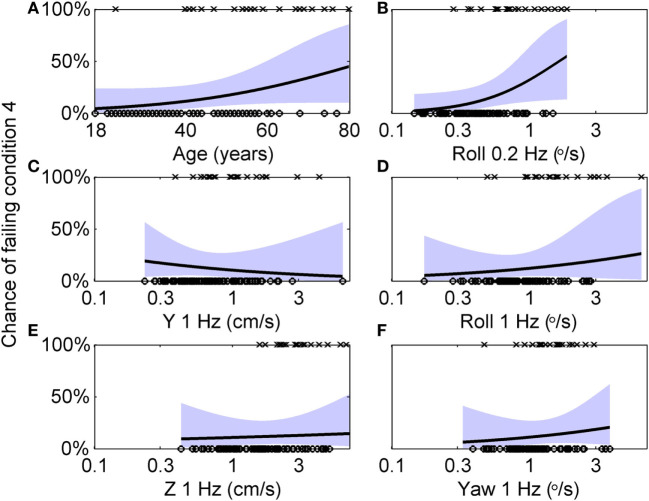
Figure 5.
Logistic regression curves showing the dependency of failing condition 4 on age and each threshold measure. (A) Circles (○) indicate individual subjects who passed condition 4, while crosses (×) indicate subjects who failed condition 4. A logistic curve showing the dependency of the chance of failing condition 4 on age, with the shaded area showing the 95% confidence intervals. Each curve is generated by holding the other five variables at the median value of their sample, so it does not show the combined influence of multiple variables. (B–F) Similar analyses for each of the five threshold measurements.

