Figure 2.
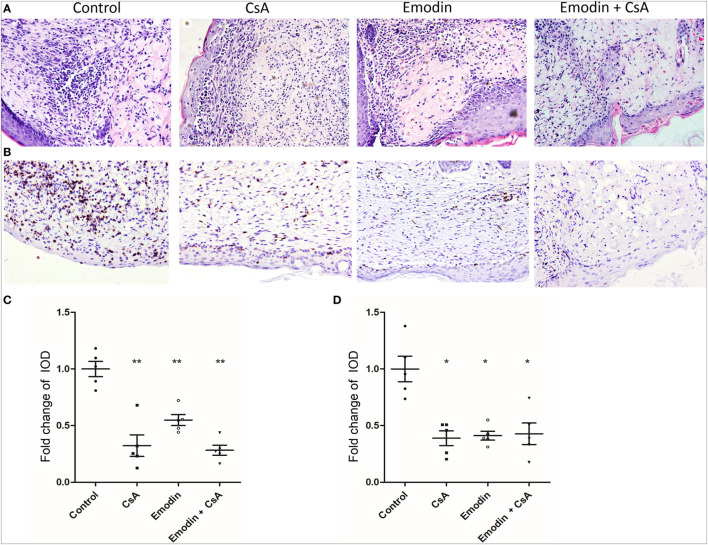
Emodin ameliorates cellular infiltration in an allograft. (A) H&E staining of skin allografts 10 days after transplantation (Magnification:200×). Representative images of skin graft sections are presented. (B) Immunohistochemistry was performed to detect infiltrating CD3+ T cells in skin grafts. Sections of skin grafts were stained with CD3-specfic antibody and imaged. Representative images of graft sections are presented. (C) The area of infiltration or inflammation in an allograft was quantified as integrated optical density (IOD) for HE-stained sections by ImagePro plus (n = 5 grafts). (D) The IOD of CD3-positive area in the images (n = 5 grafts) also was calculated by ImagePro plus (magnification at 200×). Data are shown as means ± SD for panels (C,D) (*P < 0.05, **P < 0.01).

