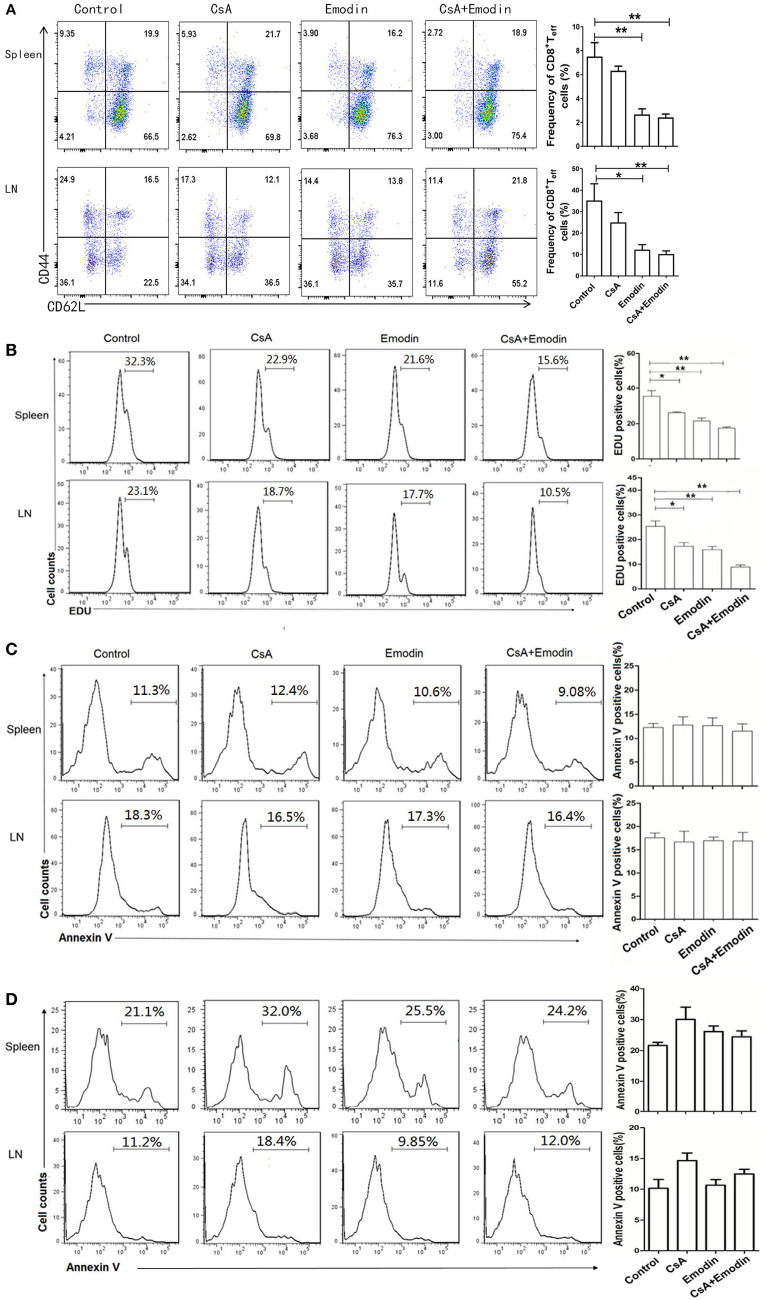
Figure 3.
Emodin suppresses the expansion of effector CD8+ T cells. (A) Draining lymph node (LN) and spleen cells from emodin- and CsA-treated B6 mice transplanted with BALB/c skin were isolated 10 days after transplantation and analyzed via FACS analysis. Column graphs show the percentages of CD8+CD44highCD62Llow effector T cells (Teff) from LNs and spleens. (B) The proliferation of CD8+CD44highCD62Llow T cells was analyzed by EDU labeling. Recipient mice were pulsed intraperitoneally with EDU 10 days after transplantation. 24 h later, LN and spleen cells were harvested and stained for CD8, CD44, CD62L, and EDU. Histograms are gated on CD8+CD44highCD62Llow population. The percentage of EDU-positive CD8+CD44highCD62Llow cells also is shown in column graphs. The apoptosis of CD8+CD44highCD62Llow (C) and CD4+CD44highCD62Llow (D) Teff cells was measured by annexin V labeling. LN and spleen cells were stained for CD8, CD4, CD44, CD62L, and annexin V and analyzed by flow cytometry. The percentage of Annexin V-positive CD8+CD44highCD62Llow and CD4+CD44highCD62Llow Teff cells is also shown in column graphs. Data are presented as means ± SD from two separate experiments (*P < 0.05, **P < 0.01, n = 4 mice/group). One representative of three separate experiments is shown for all panels.

