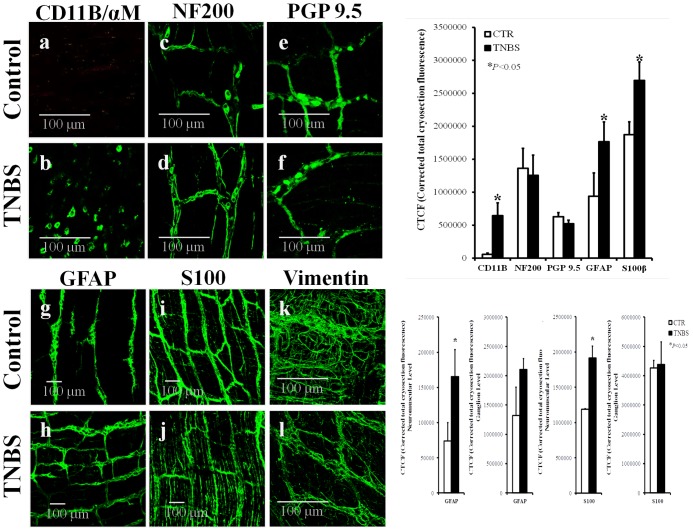
FIGURE 1.
Confocal micrographs of whole-mount preparations of the longitudinal muscle-myenteric plexus of the ileum of control (CTR) and TNBS-treated rats. Z-stacks illustrate the immunoreactivity against CD11B/αM (OX42) (marker of inflammatory cells) (a,b), NF200 (neurofilament expressed in neurons) (c,d), PGP9.5 (pan-neuronal cell marker) (e,f), GFAP (g,h) and S100β (i,j) (enteric glial cells markers), and vimentin (intermediate filament of mesenchymal cells, like ICCs and FLCs) (k,l). Images are representative of at least four different animals per group, except for vimentin where only two rats were analyzed in each group. Scale bars = 100 μm. Bar charts at the right hand-side panels represents mean ± SEM of corrected total cryosection fluorescence (CTCF) staining for each cell marker; CTCF staining discriminated by ganglion level and neuromuscular region are also shown for GFAP and S100β antibodies. ∗P < 0.05 (unpaired Student’s t-test with Welch correction) represent significant differences from control animals.

