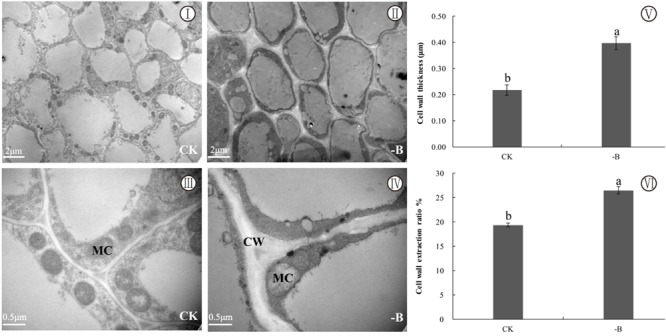
FIGURE 2.

Changes in subcellular structure and cell wall under two different boron treatments (CK: 10 μM B; -B: 0 μM B). Explanation of plate (I, II, III, IV: TEM micrographs of root cell; V: cell wall thickness; VI: cell wall extraction ratio; CW, cell wall; MC, mitochondrion). Bars represent means of four replicates ±SD. Different letters in each group indicate significant differences at the 5% probability level. Cell wall extraction ratio % = Dry weight of cell wall materials (g)/Dry weight of roots used for cell wall extraction (g) × 100%. Different letters (a, b) indicate the significant difference using the T-test (n = 6, P < 0.05) between the two different boron treatments.
