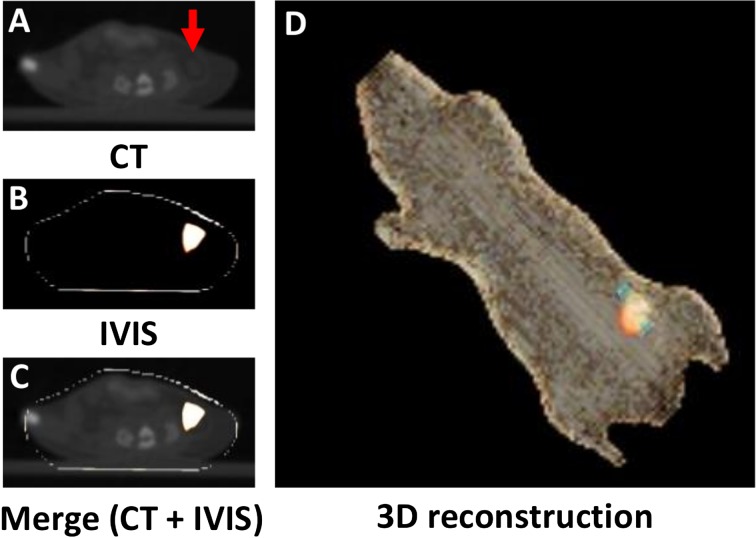
Fig. 5.
In vivo imaging of Hrem1Utr/em1Utr mice with ICG tube implantation. (A) CT plane. The arrow indicates ICG tube. (B) IVIS plane. (C) Merge (CT + IVIS). (D) 3D reconstruction of merge by OsiriX Imaging Software. Orange light indicates fluorescence signal. Blue light indicates ICG tube. The ICG tube was easily identified using an IVIS Spectrum in vivo imaging system equipped with 745 nm excitation and 820 nm emission filters.

