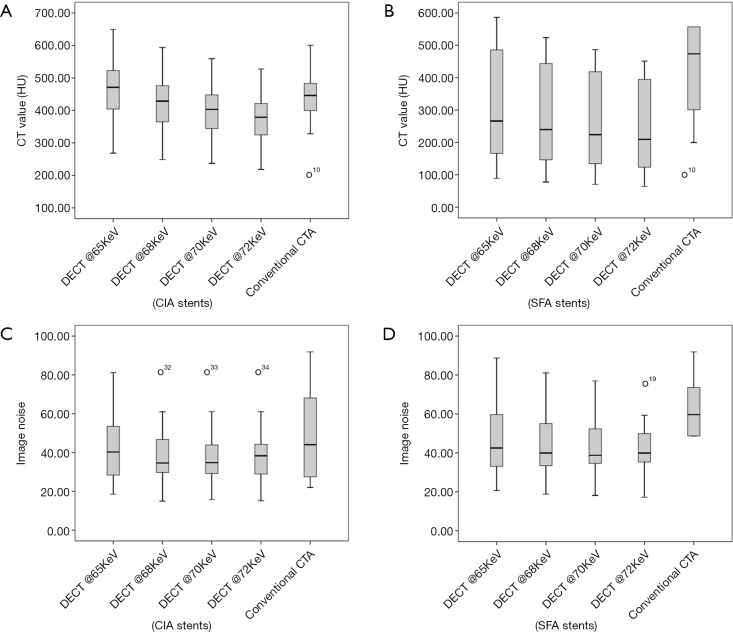
Figure 1.
Box-and-whisker plots of image quality. (A-D) Comparison between the 4 VMS and conventional CTA of CT attenuation value (HU) and image noise in measured in CIA and SFA stents. Box-and-whisker plots (O, outliers) show difference of image quality in different stent locations. VMS, virtual monochromatic spectral; CTA, CT angiography; CIA, common iliac artery; SFA, superficial femoral artery.

