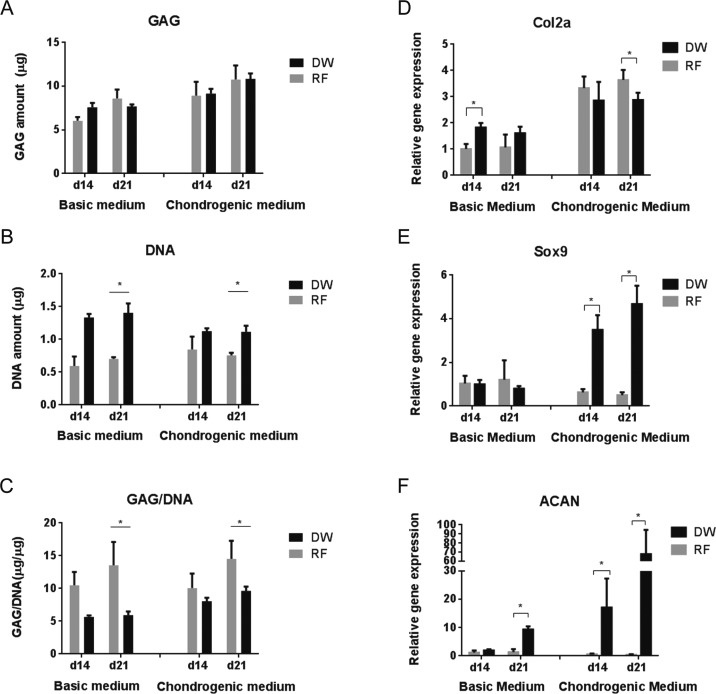
Figure 8.
Cartilaginous matrix production (A–C) and gene expression profiles (D–F) of hMSCs cultured for 14 and 21 days in basic and chondrogenic medium. (A) Total GAG amount, (B) total DNA amount, and (C) GAG normalized to the DNA content. mRNA levels of Col2A (D), Sox9 (E), and ACAN (F) are represented as fold differences relative to the expression obtained in RF samples cultured in basic medium at day 14. *p < 0.05.

