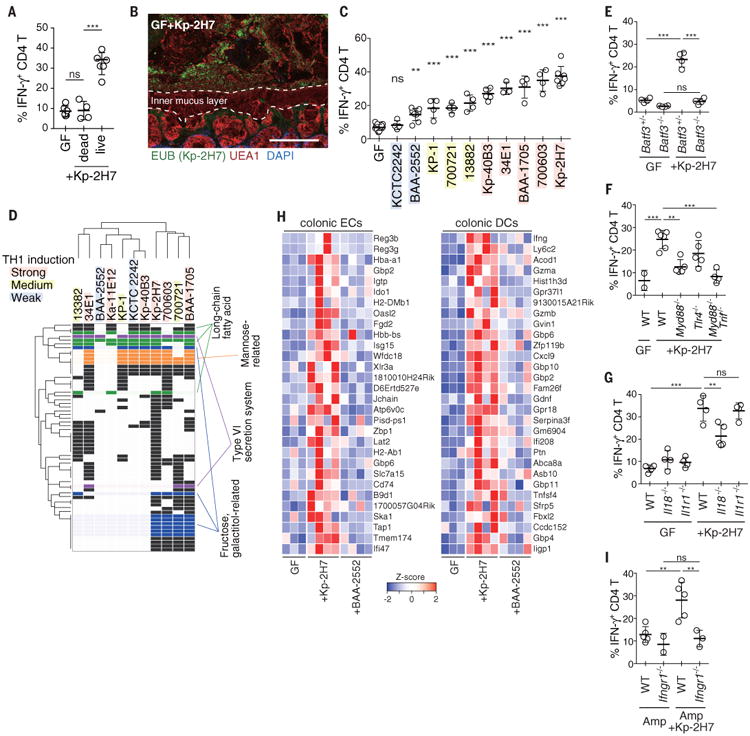
Fig. 2. Strain-specific induction of TH1 cells by K. pneumoniae.

(A) Frequency of TH1 cells in the colon of GF mice orally administered heat-killed Kp-2H7 in drinking water for 3 weeks (Kp-2H7 dead). (B) Staining with DAPI (4′,6-diamidino-2-phenylindole; blue), EUB338 FISH probe (green), and Ulex europaeus agglutinin 1 (UEA1; red) of the proximal colon of mice monocolonized with Kp-2H7. Scale bar, 100 μm. (C) GF mice were monocolonized with the indicated K. pneumoniae strain, and colonic TH1 cells were analyzed after 3 weeks. Frequencies of IFN-γ+ colonic LP CD4+TCRβ+ T cells are depicted. Colored shading is as in (D). (D) Comparative analysis of whole genomes of the tested Klebsiella strains revealed 61 orthologous groups correlating with TH1-inducing activity. Detailed information about gene ID for each row, is given table S3 and fig. S13. (E to G) The percentage of TH1 cells in the colon of WT, Batf3-/-, Myd88-/-, Tlr4-/-, Myd88-/-Trif-/-, Il18-/-, and Il1r1-/- mice monocolonized with Kp-2H7. (H) Differential gene expression in the colonic ECs and DCs from WT mice monocolonized with Kp-2H7 or BAA-2552 for 1 week. Heatmap colors represent the z-score normalized fragments per kilobase of exon per million fragments mapped (FPKM) values for each gene. (I) SPF WT and Ifngr1-/- mice were treated with Amp and gavaged with Kp-2H7 as in Fig. 1E. The percentage of TH1 cells among colonic LP CD4+ cells is depicted. Symbols represent individual mice. Error bars indicate means ± SD. **P < 0.01; ***P < 0.001; ns, not significant (P > 0.05); one-way ANOVA with post hoc Turkey's test. Data represent at least two independent experiments with similar results.
