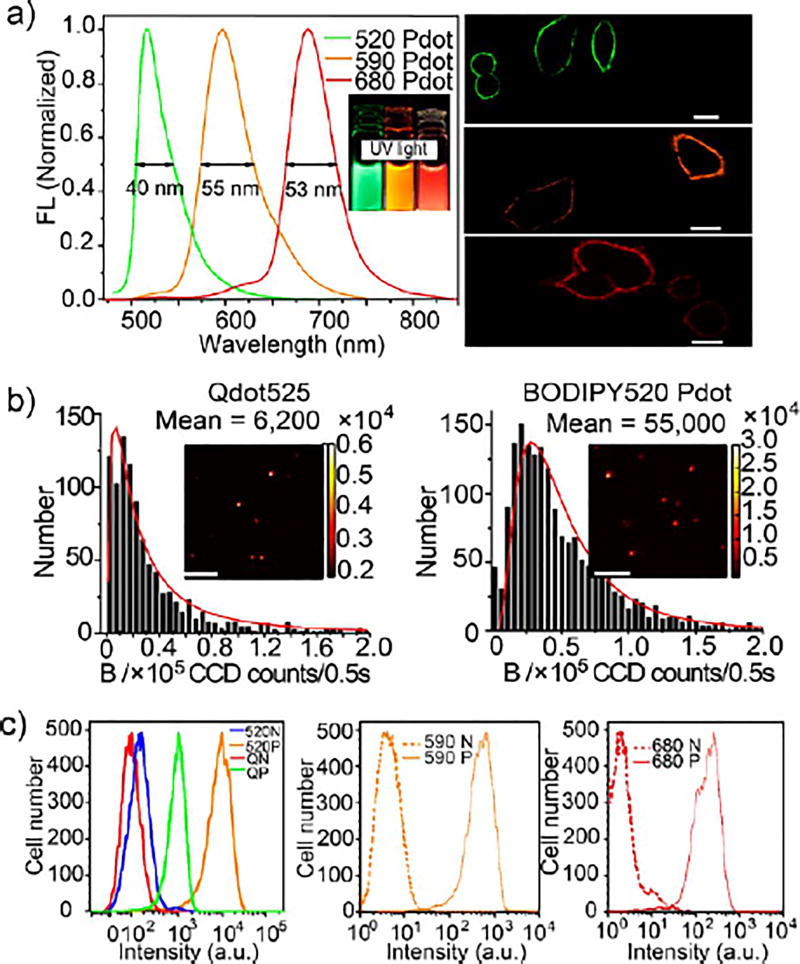
Figure 1.
(a) Left panel, fluorescence emission spectra of BODIPY 520 Pdots (λex = 405 nm), BODIPY 590 Pdots, and BODIPY 680 Pdots (λex = 450 nm); right panel, confocal fluorescence microscopy images of MCF-7 cells labeled with BODIPY 520 Pdot-SA, BODIPY 600 Pdot-SA, and BODIPY 690 Pdot-SA; scale bars: 20 mm. (b) Histograms of the distributions of single-particle brightness of Qdots 525 and BODIPY 520 Pdots (λex = 405 nm). The red curves were obtained by fitting a log-normal distribution to the histogram and gave 6200 and 55000 mean CCD counts, respectively. Insets: single-particle brightness images were obtained under identical excitation and detection conditions. All scale bars represent 10 µm. (c) Flow cytometry measurements of the intensity distributions of cells labeled via nonspecific binding (N, negative control) and positive specific targeting (P, positive) using Qdots 525 (QN, Qdot negative control; QP, Qdot positive), BODIPY 520 Pdots (520N, BODIPY 520 negative control; 520P, BODIPY 520 positive), BODIPY 590 Pdots (590, 590P), and BODIPY 680 Pdots (680N, 680P). All Qdots and Pdots were conjugated with streptavidin. Reproduced in part from Rong, Y.; Wu, C.; Yu, J.; Zhang, X.; Ye, F.; Zeigler, M.; Gallina, M. E.; Wu, I. C.; Zhang, Y.; Chan, Y.-H.; Sun, W.; Uvdal, K.; Chiu, D. T. ACS Nano, 2013, 7 (1), 376–384. (ref 21). Copyright 2013 American Chemical Society.

