Figure 5.
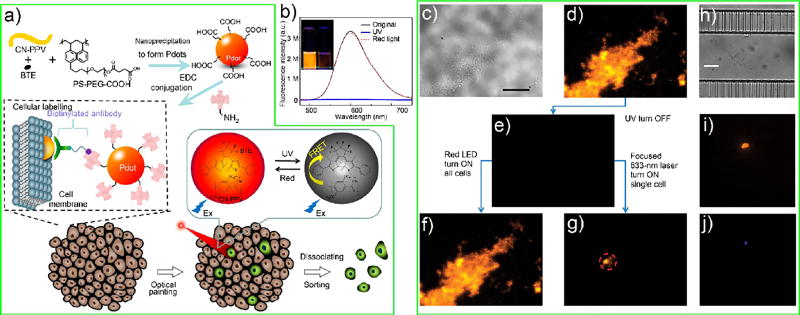
(a) Schematic depiction of Pdot formation, cellular labeling using Pdots, and optical “painting” of labeled cells with light, followed by the sorting and isolation of the painted cells. (b) The emission spectra (excitation at 450 nm) of the CN-PPV-BTE Pdots in the original ON state (black line), after UV illumination to turn the Pdots into the OFF state (blue line), after red-light illumination to return the Pdots to the ON state (red dashed line). The inset shows the photograph of the Pdot solution in the ON and OFF states. (c, d) A bright-field and fluorescence image of a tissue slice labeled with photoswitchable Pdots. (e) Application of UV light turned “off” the fluorescence of all cells in the tissue. (f, g) Fluorescence images showing the turning “on” of all cells in the tissue with wide-field illumination using a red LED (f), as well as the selective painting and turning “on” of a single cell in the tissue with a focused 633 nm laser beam (g). (h–j) The painted cells could be sorted and recovered and then observed under bright field (h), Pdot fluorescence (i), and DAPI (nuclear stain) fluorescence (j). Scale bar, 20 µm. Adapted from Kuo, C.-T.; Thompson, A. M.; Gallina, M. E.; Ye, F.; Johnson, E. S.; Sun, W.; Zhao, M.; Yu, J.; Wu, I. C.; Fujimoto, B.; DuFort, C. C.; Carlson, M. A.; Hingorani, S. R.; Paguirigan, A. L.; Radich, J. P.; Chiu, D. T., Optical painting and fluorescence activated sorting of single adherent cells labeled with photoswitchable Pdots. Nat. Commun. 2016, 7, 11468. (ref 41), Copyright 2016, Rights Managed by Nature Publishing Group.

