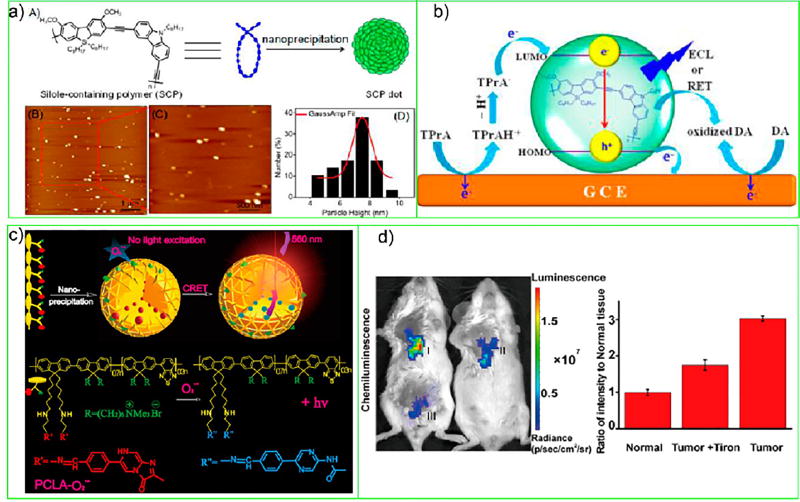
Figure 6.
(a) Scheme of the formation of SCP Pdots and their AFM images. (b) Proposed ECL mechanism of the SCP Pdot/TPrA system and ECL quenching mechanism by dopamine through resonance energy transfer. Reproduced from Feng, Y.; Lei, J.; Ju, H.; Dai, C.; Cheng, Y., Anal. Chem. 2016, 88 (1), 845-50 (ref 50). Copyright 2016 American Chemical Society. (c) Schematic illustration of CL Pdot preparation by nanoprecipitation, O2•− sensing of PCLA-O2•−, and the structure of PCLA-O2•−. (d) Representative images (pseudocolor) of mice tumor (I), tumor + Tiron (II), and normal (III) tissue followed by PCLA-O2•− (n = 3). Images (λem = 570 ± 10 nm) were acquired using an IVIS Lumina II at 30 s after PCLA-O2•− administration and quantitative CL intensities of (I-III). Reproduced in part from Li, P.; Liu, L.; Xiao, H.; Zhang, W.; Wang, L.; Tang, B., J. Am. Chem. Soc. 2016, 138 (9), 2893–2896 (ref 51). Copyright 2016 American Chemical Society.

