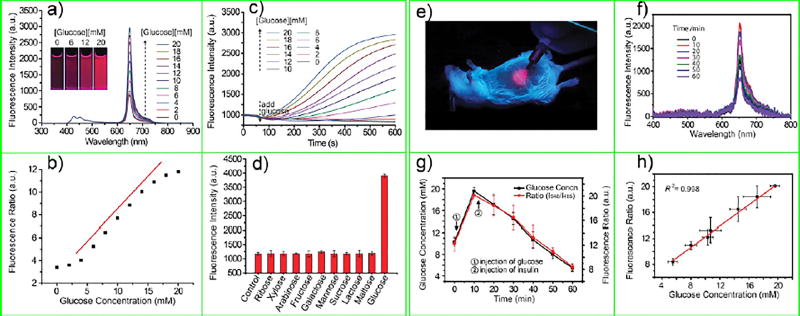
Figure 9.
(a) Emission spectra of the Pdot-GOx sensor at different glucose concentrations; the inset shows aqueous dispersions of Pdot-GOx in the presence of different glucose concentrations under a UV lamp (365 nm). (b) Ratiometric calibration plot (I648/I428) of the Pdot-GOx sensor as a function of glucose concentration. (c) Response curves of the Pdot-GOx to glucose in aqueous suspensions. (d) Selectivity of the Pdot-GOx sensor for glucose over potential interfering carbohydrates. (e) Photograph of a mouse subcutaneously injected with Pdot-GOx under 385 nm light excitation. (f) Evolution of fluorescence emission spectra of the implanted Pdot-GOx sensor in a live mouse with administration of glucose and insulin. (g) Intensity ratio of 650–480 nm emission (red data) obtained from the emission spectra in (b) and the glucose concentrations measured from the tail blood (black data). The blood glucose level was elevated and decreased by sequential intraperitoneal injection of glucose and insulin. (h) Emission intensity ratio as a function of blood glucose concentration. Reproduced from Sun, K.; Tang, Y.; Li, Q.; Yin, S.; Qin, W.; Yu, J.; Chiu, D. T.; Liu, Y.; Yuan, Z.; Zhang, X.; Wu, C., ACS Nano 2016, 10 (7), 6769–6781 (ref 79). Copyright 2016 American Chemical Society.

