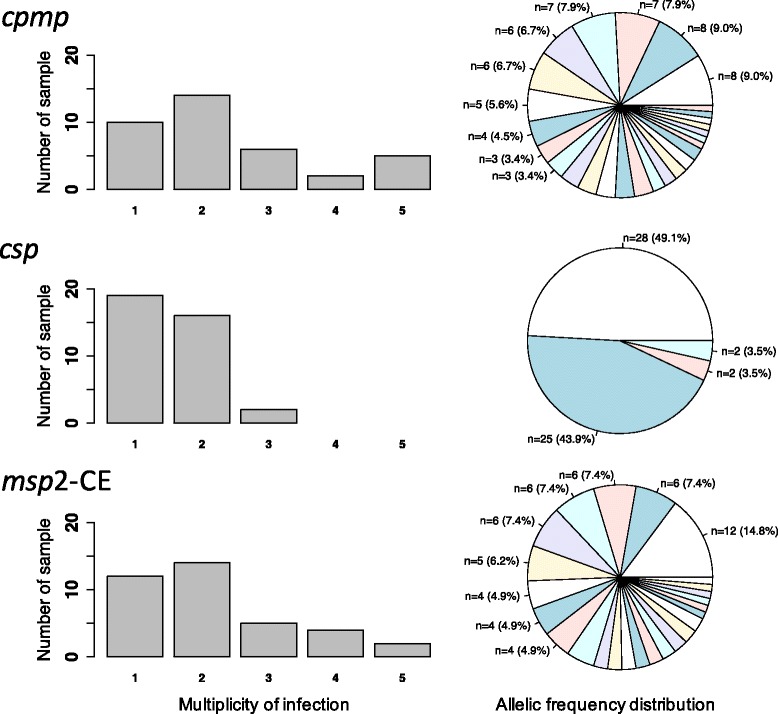
Fig. 4.

Frequency distribution of multiplicity of infection and allelic frequencies of cpmp, csp and msp2-CE. 37 P. falciparum positive samples from PNG were analysed for the 3 markers cpmp (27 haplotypes), csp (4 haplotypes) and msp2-CE (25 genotypes). Pie charts represent allelic frequency distribution for each marker in 37 samples
