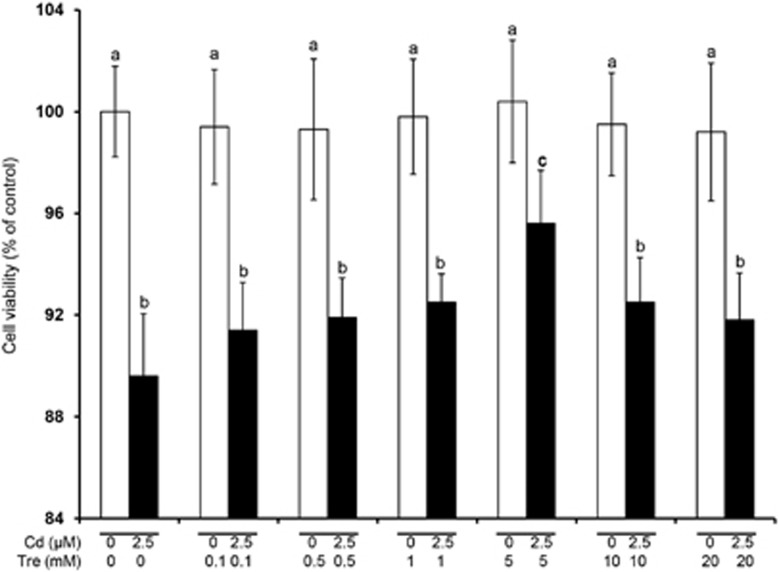
Figure 1.
Effects of Cd and/or Tre on cell viabilities in rPT cells after 12 h treatment. Cells were incubated with a range of Tre concentrations (0, 0.1, 0.5, 1, 5, 10 and 20 mM) and/or 2.5 μM Cd for 12 h to determine the cell survival. These two diverse colors were represented to point out which cells were treated with 2.5 μM CdAc2 (black) and which were not (white). Bars with different superscripts are statistically different (P<0.05)

