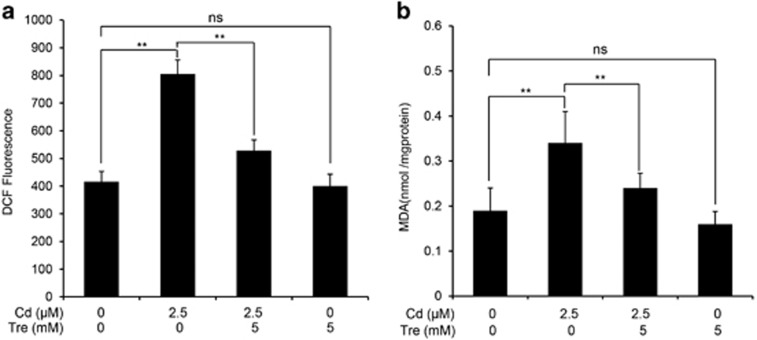
Figure 5.
Effects of Cd and/or Tre on generation of ROS and intracellular MDA levels in rPT cells. Cells were treated with 2.5 μM Cd and/or 5 mM Tre for 12 h. Then, the cells were collected. (a) The harvested cells were incubated with 100 μM DCFH-DA for 30 min at 37 °C. DCF fluorescence was measured using flow cytometer with FL-1 filter. Fluorescence results were expressed as mean fluorescence. Each bar represents mean±S.E.M. (n=6). (b) The harvested cells were used to detect the MDA levels using a commercial kit. Data are expressed as mean±S.E.M. (n=6). NS, not significant; **P<0.01

