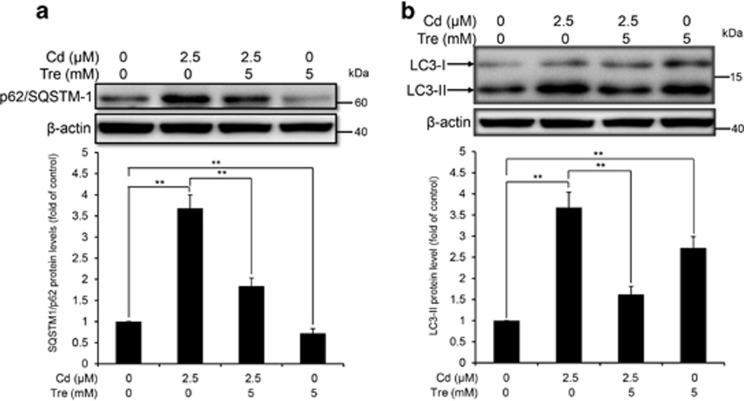
Figure 6.
Effects of Cd and/or Tre on protein levels of p62 and LC3 in rPT cells. Cells were treated with 2.5 μM Cd and/or 5 mM Tre for 12 h to assess the protein levels of p62 (a) and LC3 (b). Upper panel representative western blot image; lower panel quantitative analysis (mean±S.E.M., n=4). **P<0.01

