Figure 2.
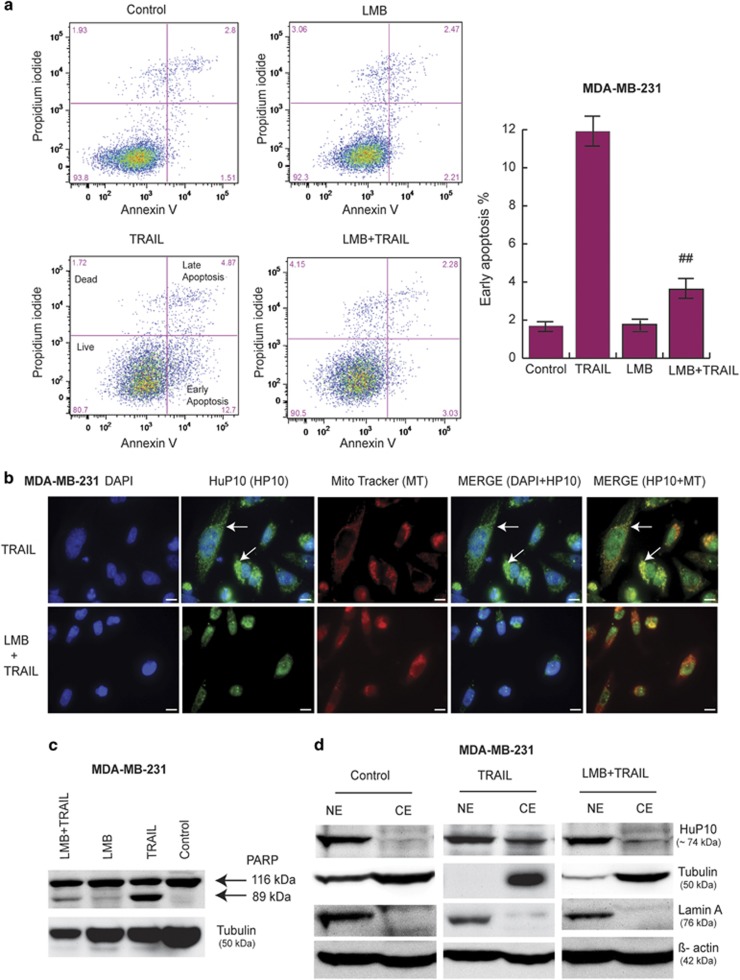
Involvement of CRM1-mediated nuclear export pathway in movement of HuP10. (a) PI/Annexin V analysis of apoptosis in MDA-MB-231 cells after treatment with only TRAIL (0.5 μg/ml) for 3 h, only LMB (5 ng/ml) for 5 h, or with LMB (5 ng/ml) for 2 h followed by TRAIL (plus LMB) for 3 h. The flow cytometry profile represents Annexin V and Propidium iodide staining along the X and Y axis, respectively. The values shown in the lower left, lower right, upper right and upper left quadrants of each panel represent the percentage of live, early apoptotic, late apoptotic and dead cells, respectively. The bar graph shows early apoptotic cells (%). Values are mean±S.E. (n=3). ##=p 0.01 versus TRAIL. (b) IF analyses of MDA-MB-231 cells treated with TRAIL (0.5 μg/ml) for 3 h (upper panels) as in Supplementary Figure S2A and with LMB (5 ng/ml) for 2 h followed by TRAIL (plus LMB) for 3 h (lower panels). Staining as in Figure 1a. Arrows in TRAIL alone treatment indicate HuP10 in the cytoplasm. Bars=10 μm. See also Supplementary Figure S5B. (c) IB analysis showing decrease in TRAIL-induced PARP cleavage in MDA-MB-231 when the cells were treated with LMB and then by TRAIL as in (a) and (b). Tubulin is a loading control. See also Supplementary Figure S4B. (d) Nuclear (NE) and cytoplasmic (CE) fractions of untreated, TRAIL-treated and LMB+TRAIL-treated cells were analyzed by IB using anti-HuP10 antibody. Lamin A and tubulin are nuclear and cytoplasmic markers, respectively. β-actin was used as a loading control. Much less HuP10 is present in the cytoplasm in LMB+TRAIL treatment then TRAIL alone treatment

