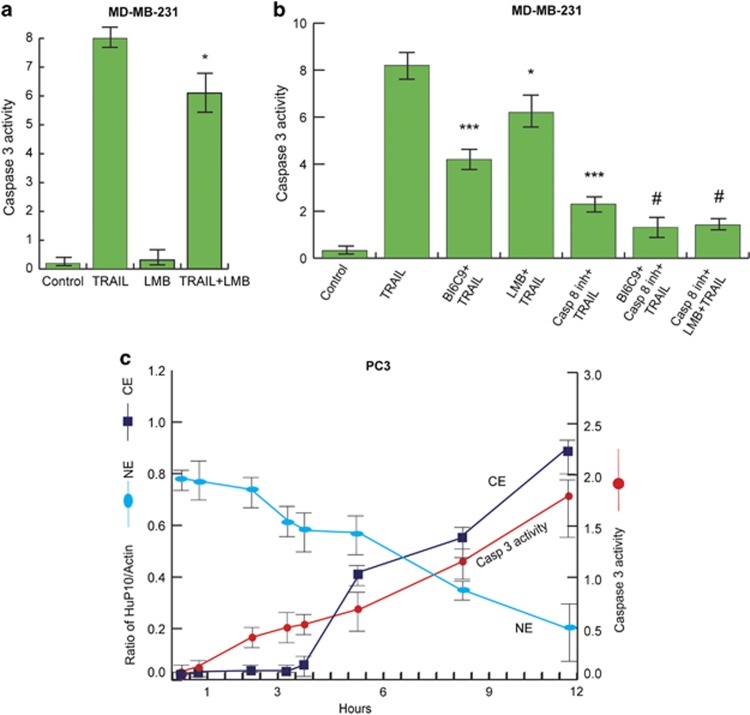
Figure 6.
Inhibitors of CRM1, tBID and caspase-8 reduce caspase-3 activity. (a) Caspase-3 activity of MDA-MB-231 cells was determined after 2 h LMB (5 ng/ml) followed by 3 h TRAIL (plus LMB) treatment. Values are mean±S.E. (n=3). *=P<0.05 versus TRAIL. (b) Caspase-3 activity of MDA-MB-231 was determined after treatment by different agents followed by TRAIL (plus agents) for 3 h. Single treatments were with tBID inhibitor (BI6C9, 100 μM, 24 h), LMB (5 ng/ml, 2 h) or caspase-8 inhibitor (Z-IETD-FMK, 40 μM, 3 h). Double treatments were addition of Z-IETD-FMK after 21 h of BI6C9 treatment (3 h double, 24 h total) and addition of LMB after 1 h of Z-IETD-FMK treatment (2 h double, 3 h total). Values are mean±S.E. (n=3). * and *** are P<0.05 and P<0.001, respectively, versus TRAIL. #=P<0.05 versus caspase-8 inhibitor +TRAIL. (c) Time course of HuP10 movement and caspase-3 activity. PC3 cells were treated with TRAIL for the time periods as indicated. Then HuP10 levels (relative to β-actin) in nuclear (NE) and cytoplasmic (CE) fractions, and caspase-3 activity were determined. Values are mean±S.E. (n=2)

