Figure 1.
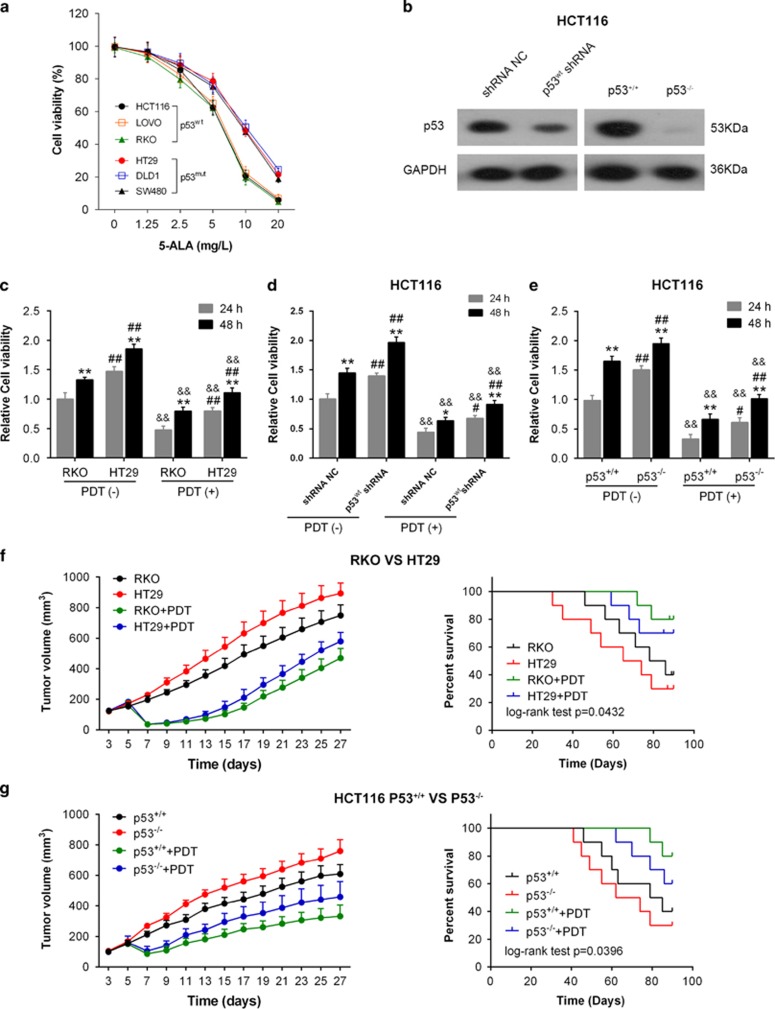
The effect of PDT on cell viability, tumor size and survival percentage. (a) The viability of all CRC cells in response to PDT treatment in a concentration-dependent manner was determined by using CCK-8 assays. (b) The p53 protein levels in shRNA NC- or p53wt shRNA-transfected HCT116 cells and p53+/+/p53−/− HCT116 cells were determined using western blotting assays. (b) The viability of p53wt RKO and p53mut HT29 cells was determined at 24 and 48 h in the presence or absence of PDT treatment by using CCK-8 assays. (c) HCT116 cells were transfected with shRNA NC or p53wt shRNA. Then the cell viability was determined at 24 and 48 h in the presence or absence of PDT treatment by using CCK-8 assays. (d) The viability of p53+/+/p53−/− HCT116 cells was determined at 24 and 48 h in the presence or absence of PDT treatment by using CCK-8 assays. (e) Tumor volumes of tumors derived from p53wt RKO or p53mut HT29 cells in the absence or presence of PDT treatment were determined every 2 days from day 3 to day 27. The survival analysis was performed to analyze the survival percentage of the mice in the indicated groups. (f) Similar assays were performed to analyze p53+/+/p53−/− HCT116 cell-derived tumor mice. The data are presented as mean±S.D. of three independent experiments. *P<0.01, 48 h group versus 24 h group; #P<0.05, ##P<0.01, HT29 group versus RKO group or p53wt shRNA group versus shRNA NC group or p53−/− HCT116 group versus p53+/+ HCT116 group; &&P<0.01, PDT (+) group versus PDT (−) group

