Figure 2.
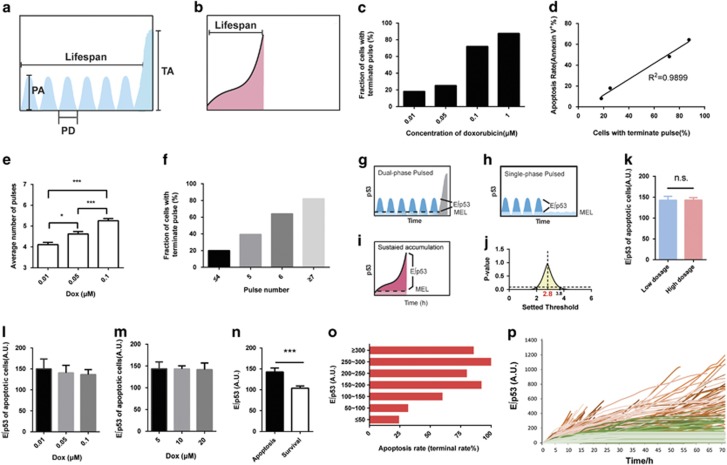
Integral cumulative levels of p53 over a threshold control cell fates. (a) Prolonged low-dose treatment of Dox (0.1 μM) initiated a series of pulses and then abruptly increased to a high-amplitude level of p53 (defined as ‘terminal pulse’). Metrics used to describe the dynamic pattern are pulse amplitude (PA), lifespan, pulse duration (PD), and terminal amplitude (TA). (b) Acute Dox treatment (10 μM) induced a sustained accumulation of p53. (c) The fraction of cells showing terminal pulses within 96 h under Dox treatments as specified. Number of cells (n)=121 (0.01 μM), n=127 (0.05 μM), n=118 (0.1 μM) and n=54 (1 μM). (d) Correlation analysis of apoptosis rate (Annexin V-positive rate) and the fraction of cells showing terminal pulse within 96 h (n=420 in total for single-cell analysis). (e) The average number of pulses in response to different dose of Dox stimuli. Number of cells (n)=121 (0.01 μM), n=127 (0.05 μM), and n=118 (0.1 μM). Data are represented as mean±S.E.M.; *P<0.05; ***P<0.001. (f) The fraction of cells showing terminal pulse after corresponding number of p53 pulses. The cell fraction in each bin was calculated by summarizing the number of cells showing corresponding number of pulses followed by dividing them by the total number of cells included in panel (e) (n=366). (g–j) Schematic illustration of a predicted threshold in initiating apoptosis. The presumed threshold is defined as MEL and the p53 accumulation above MEL as effective cumulative level of p53 (E∫p53) (g–i). The threshold was searched at a step of 0.1 A.U. from 0 to 5 A.U., and the value that delivered identical E∫p53 with the maximum P-value was designated as the threshold (j). (k) Average levels of E∫p53 from apoptotic cells treated with low (0.01–0.1 μM for 72 h, n=139) or high dose (5–20 μM for 8 h and cultured to 48 h, n=214) of Dox (threshold=2.8 A.U.). Data are represented as mean±S.E.M. (l and m) Average levels of E∫p53 from apoptotic cells treated with low (n=139) and high concentration (n=214) of Dox are shown, respectively. (n) E∫p53 level in apoptotic (n=227) and survival cells (n=139) within 96 h. Error bars represent S.E.M.; ***P<0.001. (o) Apoptotic rate (%) of cells that display corresponding levels of E∫p53. (p) Single-cell traces of E∫p53 in surviving cells (green) and apoptotic cells (red). Single-cell data for panels (o) and (p) were calculated using cells treated with 0.01, 0.1 and 10 μM Dox (n=367 in total). Cell fate can be identified visually by morphological changes observed using the bright-field channel. NS, not significant

