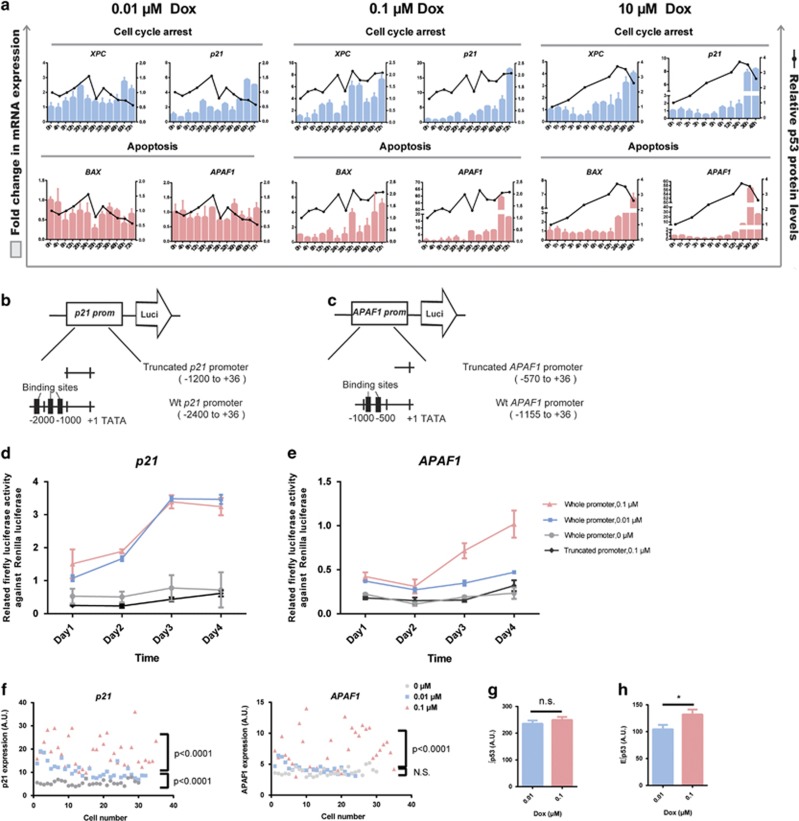
Figure 4.
E∫p53 differentiates the transactivation of different sets of target genes. (a) Expression of p53 target genes. mRNA levels of target genes under the indicated conditions are shown in histograms. Genes are grouped into cell cycle arrest- and apoptosis-related genes. Data of transcripts are mean±S.D. Relative p53 protein levels normalized to GAPDH are shown as black lines. (b) Luciferase reporter gene assay, using wild-type p21 promoter (−2400 to +36 bases, pGL3-p21-Luci) and a truncated p21 promoter (−1200 to +36 bases) with deletion of three reported p53-binding sites. (c) Luciferase reporter gene assay, using wild-type APAF1 promoter (−1155 to +36 bases, pGL3-APAF1-Luci) and a truncated APAF promoter (−570 to +36 bases) with deletion of two reported p53-binding sites. (d and e) Relative luciferase activity in MCF7 cells transfected with p21 (d) and APAF1 (e) promoter reporters. Dual luciferase reporter assay was performed by transfecting p21 or APAF1 luciferase reporter construct together with pRL-SV40 vector as an internal standard. Truncated luciferase reporter construct was transfected as negative control. Cells were treated with 0.01 and 0.1 μM Dox for 1–4 days. Data are presented as mean±S.E.M. from three independent experiments. (f) FISH analysis of APAF1 and p21 transcripts after 0.01 and 0.1 μM Dox treatment for 72 h. n=30 (0 μM), n=31 (0.01 μM), and n=35 (0.1 μM). Unpaired Student’s t-test was conducted to determine the significance. (g and h) Average cumulative level of p53 (∫p53) (g) and effective cumulative level of p53 (E∫p53) (h) levels in cells treated with 0.01 μM (n=121) and 0.1 μM (n=118) Dox within 96 h. Data are represented as mean±S.E.M.; *P<0.05; NS, not significant

