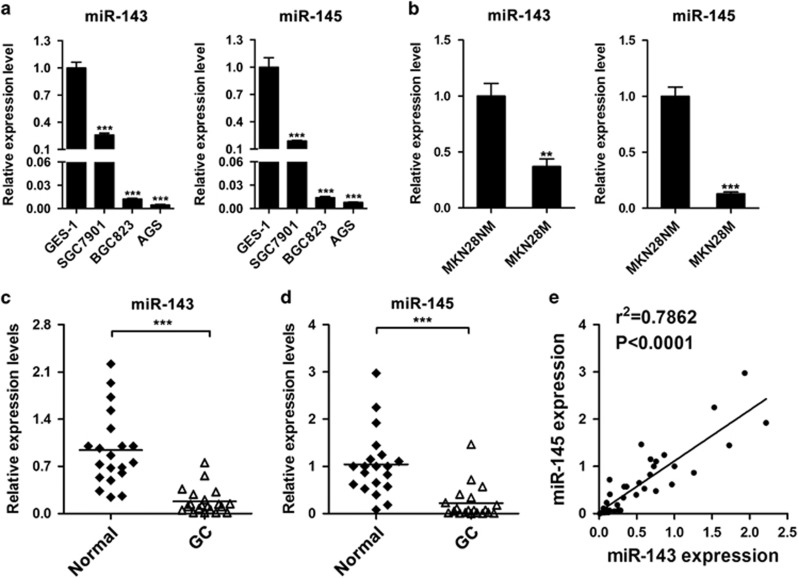
Figure 1.
The expression levels of miR-143 and miR-145 in gastric cancer cells and clinical tissues. (a) The expression levels of miR-143 and miR-145 in three gastric cancer cell lines and one normal gastric epithelial cell line. (b) The expression levels of miR-143 and miR-145 in low and high-metastatic gastric cancer cell lines. (c,d) The relative expression levels of miR-143 and miR-145 in adjacent normal tissues and gastric cancer tissues. (e) Correlation between miR-143 expression and miR-145 expression in clinical samples. **P<0.01, ***P<0.001

