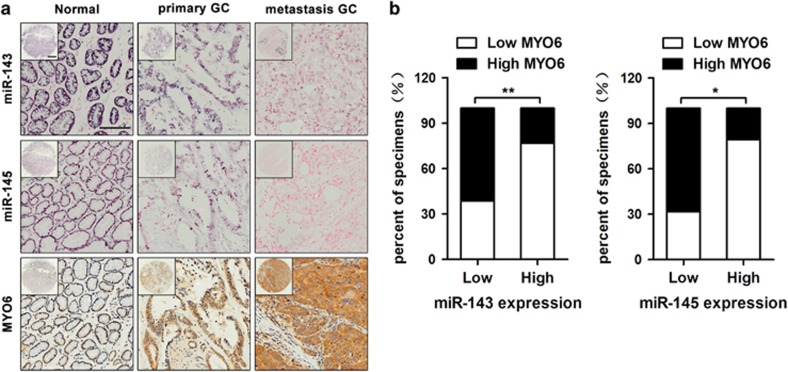
Figure 6.
The expression levels of miR-143, miR-145 and MYO6 in GC specimens. (a) The expression levels of miR-143, miR-145 and MYO6 in normal (left), primary GC (middle) and metastatic GC (right) tissues, scale bars: 500 μm (top) and 200 μm (bottom). (b) The correlation between MYO6 expression and miR-143 and miR-145 levels in GC specimens. *P<0.05, **P<0.01

