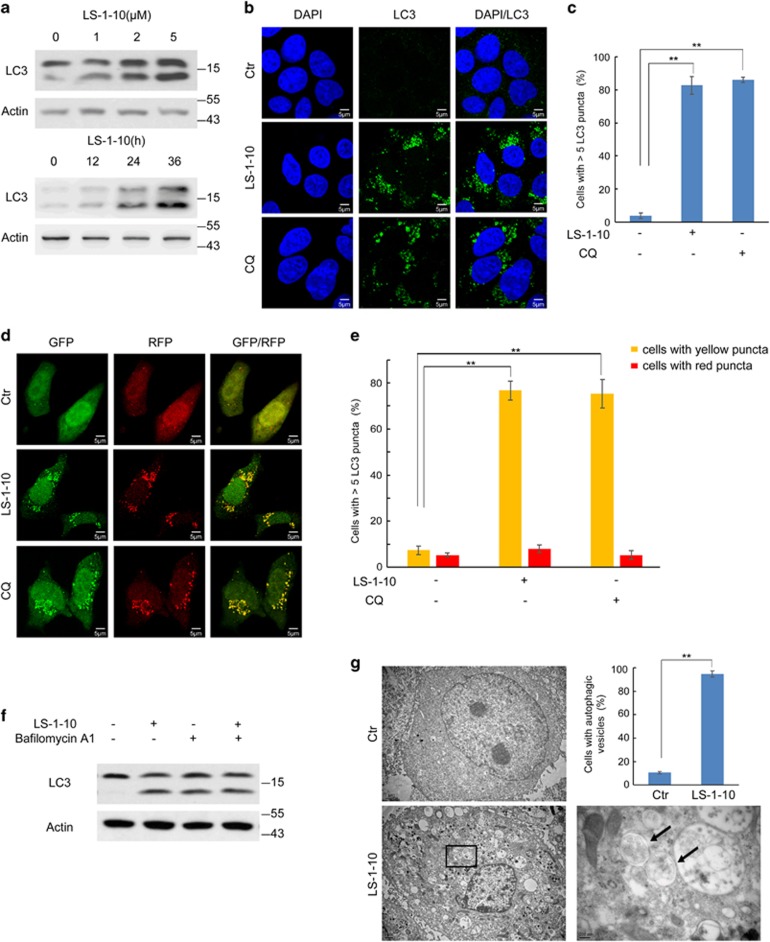
Figure 2.
LS-1-10 inhibits autophagic degradation. (a) DLD1 cells were treated with different concentrations of LS-1-10 (1, 2 and 5 μM) for 24 h (upper panel) or 5 μM LS-1-10 over a time course (lower panel). Immunoblotting was performed using an LC3 antibody. (b) DLD1 cells were incubated with 5 μM LS-1-10 or 10 μM chloroquine (CQ) for 24 h. Immunofluorescence was performed after staining with an LC3 antibody. Scale bars, 5 μm. (c) Quantification of the LC3-positive punctate cells shown in (b). Only cells with more than five puncta were counted. Data represent the means±S.D. (n=3). Student’s t-test, **P<0.01. (d) DLD1 cells were transfected with ptfLC3 and then treated with 5 μM LS-1-10 or 10 μM CQ for 24 h. The distribution of GFP/RFP-LC3 was examined by confocal microscopy. (e) Quantification of the LC3 puncta shown in (d). Data represent the means±S.D. based (n=3). Student’s t-test, **P<0.01. (f) DLD1 cells were treated with 5 μM LS-1-10, 100 nM bafilomycin A1, or both for 24 h. Whole-cell lysates were extracted for immunoblotting with the indicated antibodies. (g) Autophagic vesicles or autophagosomes in DLD1 cells were observed by electron microscopy after 24 h of 5 μM LS-1-10 treatment. Arrows in the enlargement indicate autophagic vesicles. The graph shows a statistical analysis of autophagic vesicles in DLD1 cells upon LS-1-10 treatment. Data represent the means±S.D. (n=3). Student’s t-test, **P<0.01

