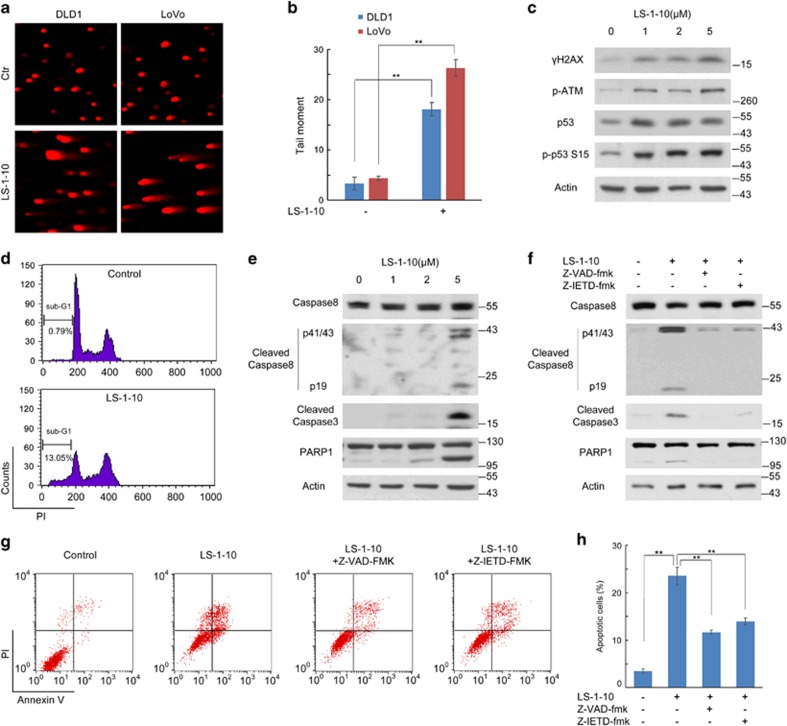
Figure 5.
LS-1-10 induces DNA damage and apoptosis. (a) DLD1 and LoVo cells were treated with 5 μM LS-1-10 for 48 h, and collected for comet assays. (b) Quantification of the data shown in (a). Data represent the means±S.D. (n=3). Student’s t-test, **P<0.01. (c) DLD1 cells were treated with different concentrations of LS-1-10 (1, 2, 5 μM) for 48 h. Immunoblotting was performed to detect the phosphorylation of H2AX (Ser129), ATM (Ser1981) and p53 (Ser15). (d) DLD1 cells treated with DMSO or 5 μM LS-1-10 were collected for propidium iodide (PI) staining. The DNA contents were analyzed by flow cytometry. (e) DLD1 cells were treated with different concentrations of LS-1-10 (1, 2 and 5 μM) for 48 h. Immunoblotting was performed to detect the cleavage of caspase 8, caspase 3 and PARP1. (f) DLD1 cells were treated with 5 μM LS-1-10 in the absence or presence of Z-VAD-FMK or Z-IETD-FMK for 48 h. Immunoblotting was performed to detect the cleavage of caspase 8, caspase 3 and PARP1. (g) Cells treated as in (f) were subjected to flow cytometry to detect AnnexinV/PI staining. (h) Quantification of the apoptotic cells shown in (d). Data represent the means±S.D. (n=3). Student’s t-test, **P<0.01

