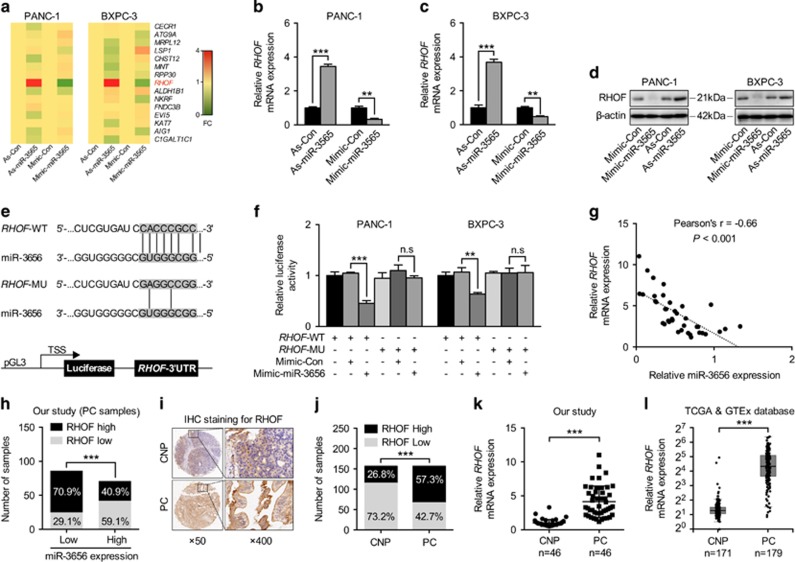
Figure 3.
miR-3656 directly targets RHOF and represses its expression. (a) A heat map of the expression changes of 15 candidate genes predicted to be targets of miR-3656 in PANC-1 and BXPC-3 cells transfected with miR-3656 mimic, antagomir or negative control. The scale from 0 to 4 marks the intensity of differential regulation of mRNAs: low expression (green), mid expression (yellow), and high expression (red). (b–d) The expression of RHOF in PANC-1 or BXPC-3 cells transfected with miR-3656 mimic, antagomir or negative control as examined by qPCR and western blotting. (e) Schematic diagram showing the predicted binding sequence between RHOF and miR-3656. The wild-type (WT) and mutant (MU) 3′-UTR of RHOF were cloned into luciferase reporter constructs. (f) The relative luciferase activity of either WT or MU 3′-UTR of RHOF reporter with miR-3656 mimic addition in PANC-1 and BXPC-3 cells. (g) The relationship of the expression between miR-3656 and RHOF in 46 fresh PC tissues via qPCR assay. (h) Calculated percentages of RHOF expression in either miR-3656 low or high expression groups from 157 PC FFPE samples. (i and j) Representative images and semiquantitative analyses of IHC staining for RHOF in 157 PC and CNP FFPE tissues. (k) qPCR examination of RHOF levels in 46 PC and CNP tissues. (i) TCGA and GTEx database data showing the relative RHOF expression levels in PC and CNP tissues. RNU6B snRNA was used to normalize the qPCR results. All n=3; bar, S.E.M., n.s, not significant, *P<0.05; **P<0.01; ***P<0.001; Student’s t-test or χ2 test

