
Figure 1.
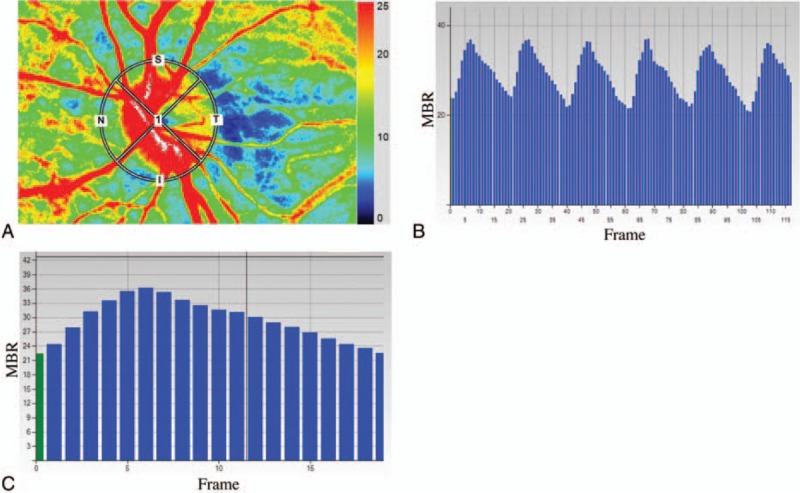
Analysis of the pulse waveform at the optic nerve head (ONH) using laser speckle flowgraphy (LSFG). Representative color coded composite map (A). By this circle rubber band at the ONH, the mean blur rate (MBR) and other waveform parameters can be measured (A). Pulse waves showing changes in the MBR, which is tuned to cardiac cycle for 4 seconds. The total number of frames is 118 in a scan (B). The change of the MBR in 1 heartbeat (C).