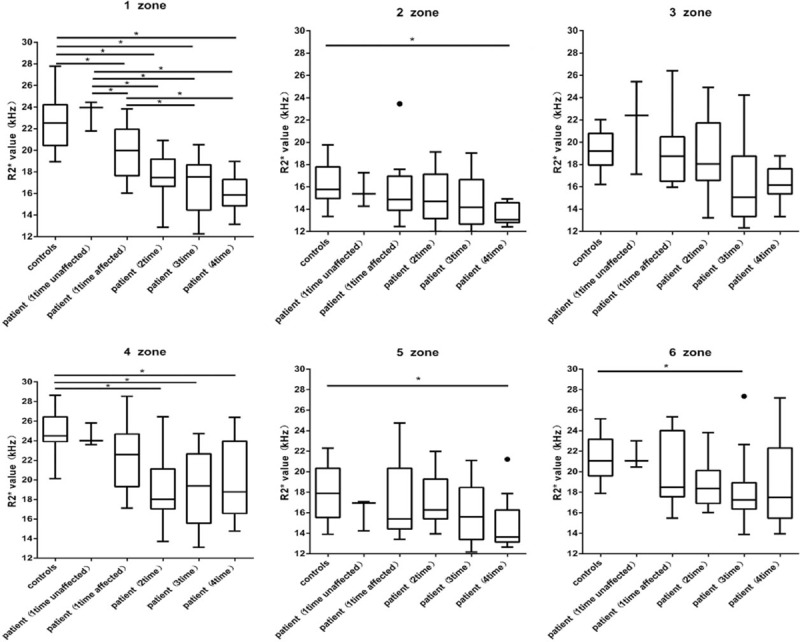
Figure 3.

Box plot diagram of R2∗ values in all zones, revealing a marked decline in R2∗ when the control group and the FHON group were compared 4 times. In zone 1, there was a significant decrease in the R2∗ value at the first comparison and a continuous decrease at the other time points. FHON = femoral head osteonecrosis, R2∗ = total transverse relaxation time.
