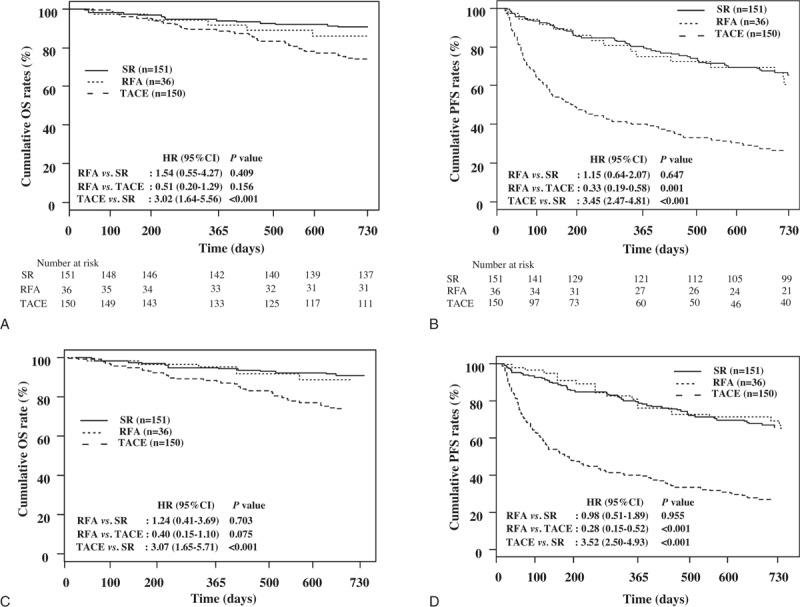
Figure 4.

Comparison of short term (≤2 year) overall survivals and progression free survivals of patients by treatment type. The cumulative OS and PFS rates were not significantly different between RFA and SR group (A and B, respectively, P > .05), even after PS weighting (C and D, respectively, P > .05). The cumulative OS rates of RFA group were not significantly different compared with TACE group (A, P = .156), but after PS weighting, the cumulative OS rates tended to be higher in the RFA group than in the TACE group (C, P = .075). However, the cumulative PFS rates were significantly higher in the RFA group than in the TACE group (B, P = .001), even after PS weighting (D, P < .001). The cumulative OS rates and PFS rates were significantly higher in the SR group than in the TACE group, before (A and B, respectively, P-values for all <.001) and after PS weighting (C and D, P-values for all <.001). OS = overall survival, PFS = progression-free survival, RFA = radio frequency ablation, SR = surgical resection, TACE = transarterial chemoembolization.
