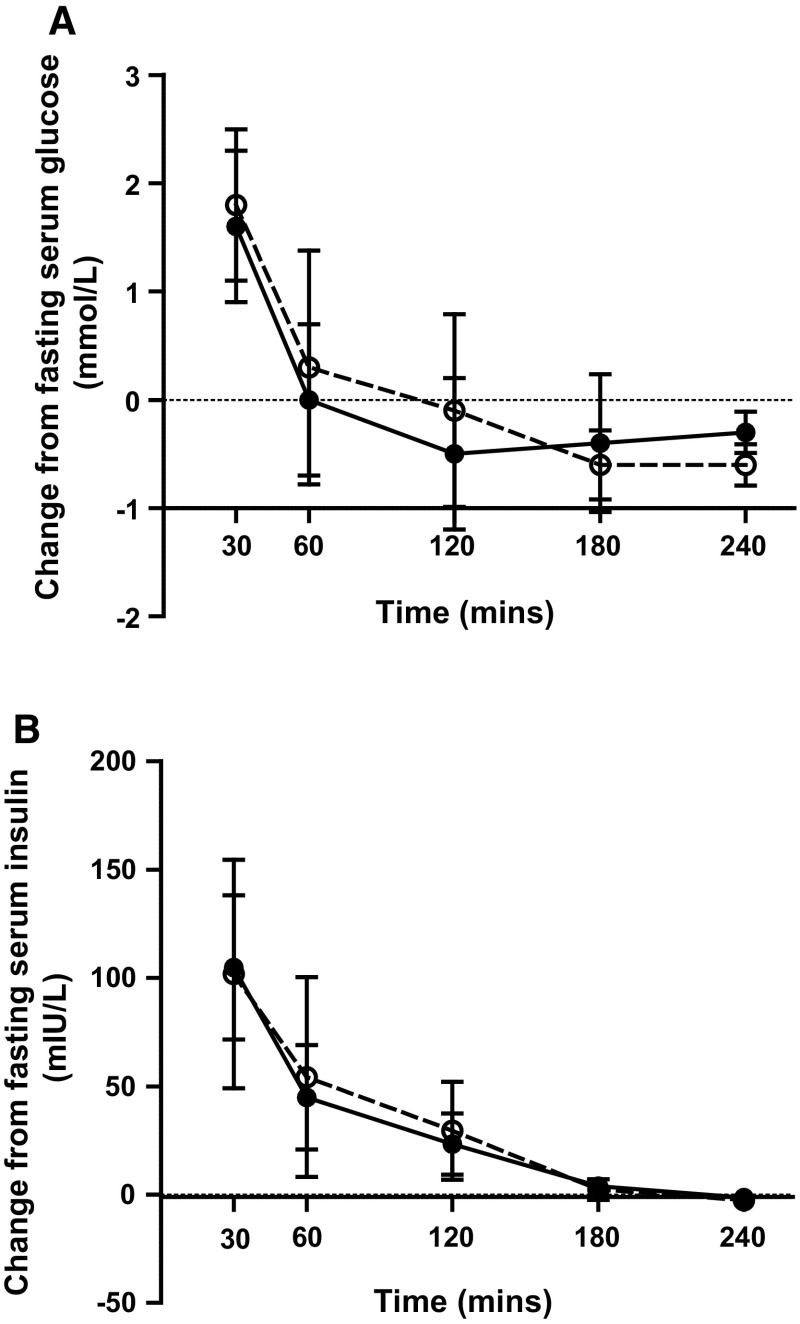
Fig. 2.
Mean change in serum a glucose and b insulin concentrations and 95 % CIs in healthy men (n = 12) after test meals containing 50 g experimental fat from non-IE PSt/PK (open circles) and IE PSt/PK (filled circles). Deviations from fasting values were analysed by ANOVA, with the two meals and time (0–240 min) as factors: time effects for both P < 0.001

