Fig. 2.
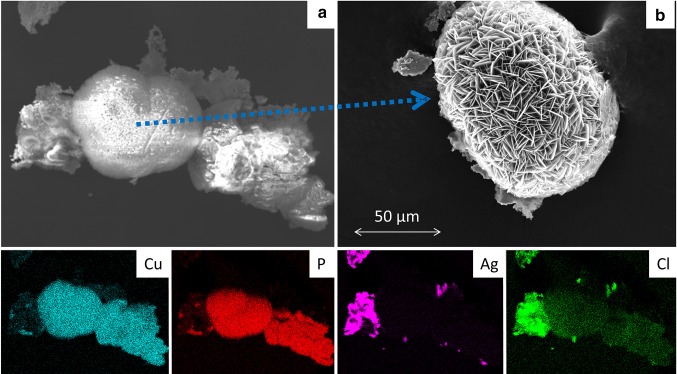
REM images and EDX maps of turquois deposits formed on bands after 6-month immersion in artificial saliva solution. a Typical REM image of a deposit together with EDX elemental maps of Cu, P, Ag, and Cl. No nickel could be detected by EDX. b Enlarged REM image of a structure similar to the center of image in a. b Image recorded after gold-sputtering for better image quality. Note that images a and b are two different particles
Abb. 2 REM-Bilder und EDX-Abbildungen von türkisfarbenen Ablagerungen auf den Bändern nach 6-monatiger Lagerung in künstlicher Speichellösung. a Typisches REM-Bild einer Ablagerung zusammen mit EDX-Elementarhochbildkarten von Cu, P, Ag und Cl. Nickel konnte von EDX nicht erkannt werden. b Vergrößertes REM-Bild einer Struktur ähnlich der Bildmitte in a. Die Abbildung b wurde zwecks beserer Bildqualität nach Goldpulverisierung aufgezeichnet. Man beachte, dass es sich in den Abbildungen a und b um 2 verschiedene Partikel handelt

