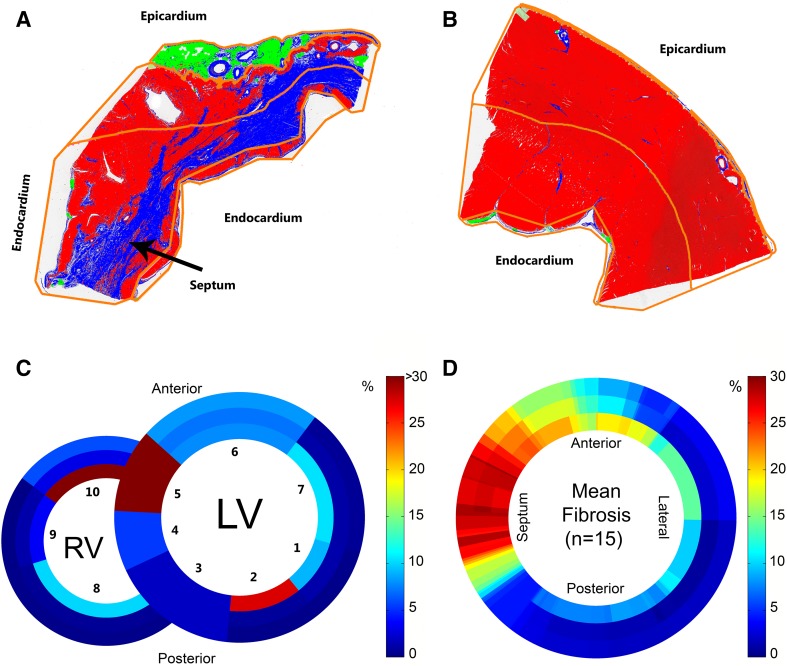
Fig. 3.
Results of histological analysis. a, b Results of the histological analyses of sections 5 and 7, respectively (Fig. 2a, b). Connective tissue (blue), cardiomyocytes (red) and adipose tissue (cells with non-stained cytoplasm; pseudo green). The orange lines indicate the endocardial to epicardial subsegmentation. c, d. The color bar denotes the percentage of fibrosis found based on histology. c Analysis of the whole heart of this animal, the numbers indicated the histological sections, 5 and 7 correspond to subfigures a and b, respectively. d Mean fibrosis content in the left ventricle of all animals (n = 15). LV left ventricle; RV right ventricle

