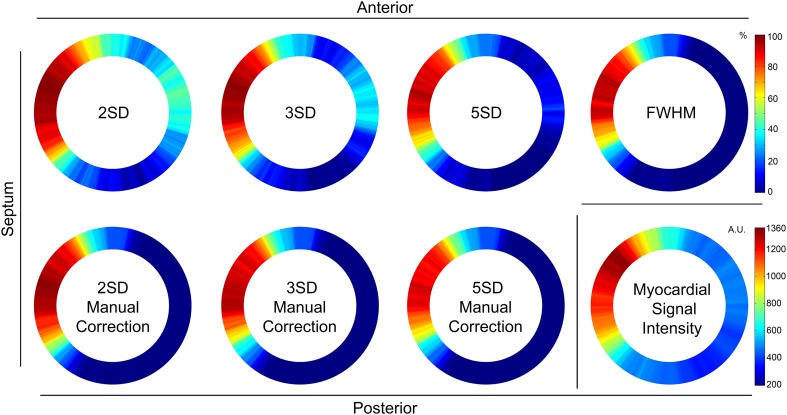
Fig. 6.
Mean late gadolinium enhancement analysis (n = 15). Averaged results of the fraction of transmurality in 360 segments for the 2, 3 and 5SD automatic methods, the 2, 3 and 5SD from remote manually corrected subgroup and the fully automatic FWHM analysis. In the bottom right corner, the averaged myocardial signal intensity is shown. AU arbitrary unit, FWHM full width at half maximum, SD standard deviation

