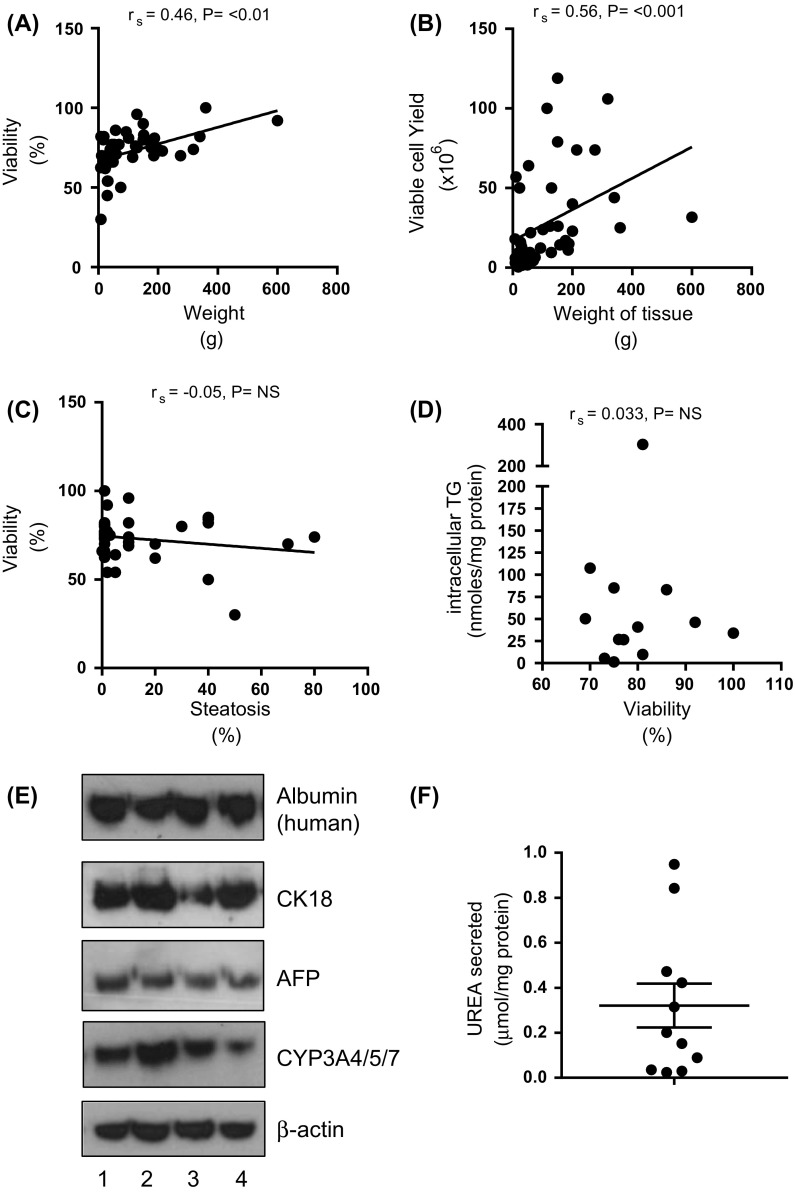
Fig. 1.
Correlations between a total weight of liver tissue and hepatocyte viability (%) (rs = 0.46, P < 0.001, n = 44); b total weight of liver tissue and hepatocyte yield (viable cells only, ×106) (rs = 0.56, P < 0.001, n = 44); c histologically graded steatosis (%) and hepatocyte viability (%) (rs = −0.05, P = NS, n = 39); and d intracellular triglyceride (TG) content of isolated hepatocytes after 24 h in culture (nmoles/mg protein) and percentage viability of hepatocytes following isolation (rs = 0.03, P = NS, n = 12). e Western blot analysis of 4 separate hepatocyte cell isolations (1–4). β-actin was used to ascertain equal gel loading; and f the concentration of urea in cell medium after 24 h culture of hepatocytes [µmol/mg protein of cells in the well above background (n = 10)]. Background taken as fresh medium that had not been cultured with cells

