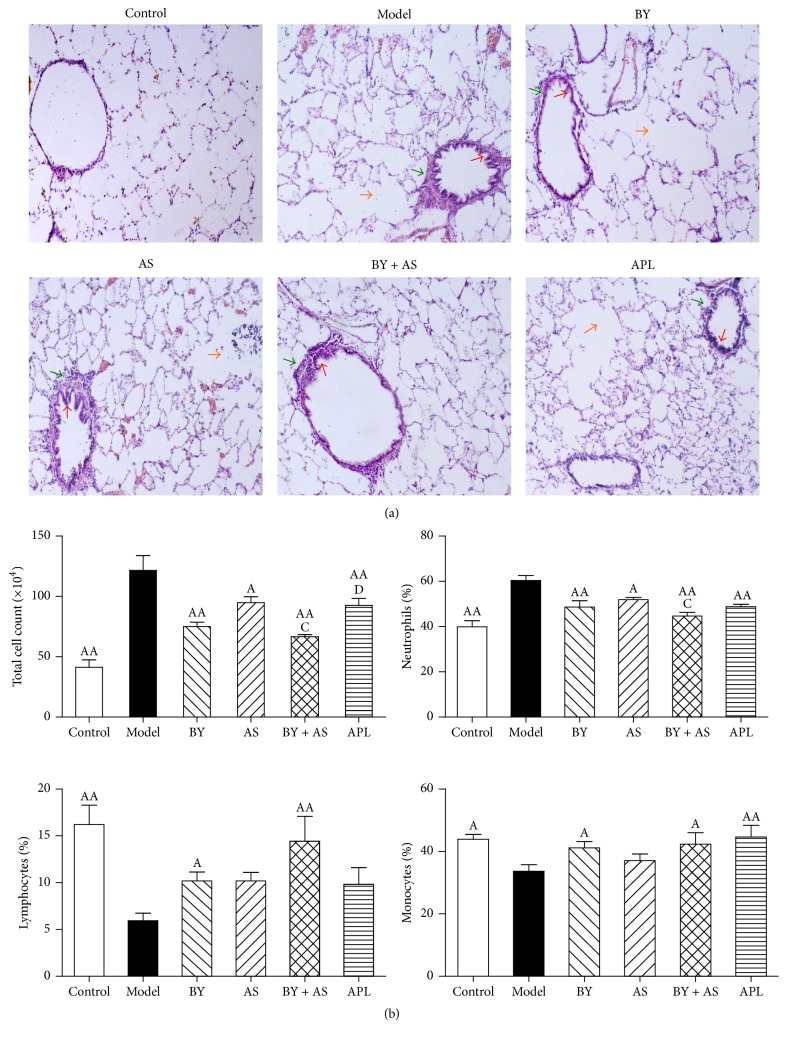
Figure 2.
Lung morphology and total and differential cell counts in BALF of each group. Control: control group; Model: model group; BY: Bufei Yishen group; AS: acupoint sticking group; BY + AS: Bufei Yishen + acupoint sticking group; APL: aminophylline group (the same as below). Pathological changes in the lungs of each group (H&E stained ×100) (a). The orange arrows: alveolar cavity expansion; the red arrow: airway epithelial-cell hyperplasia; the green arrow: thickened small conducting airways. The total and differential cell counts in BALF (b): values are expressed as the mean ± SEM. AAP < 0.01, AP < 0.05 versus Model group; CP < 0.05 versus AS group; DP < 0.05 versus BY + AS group.

