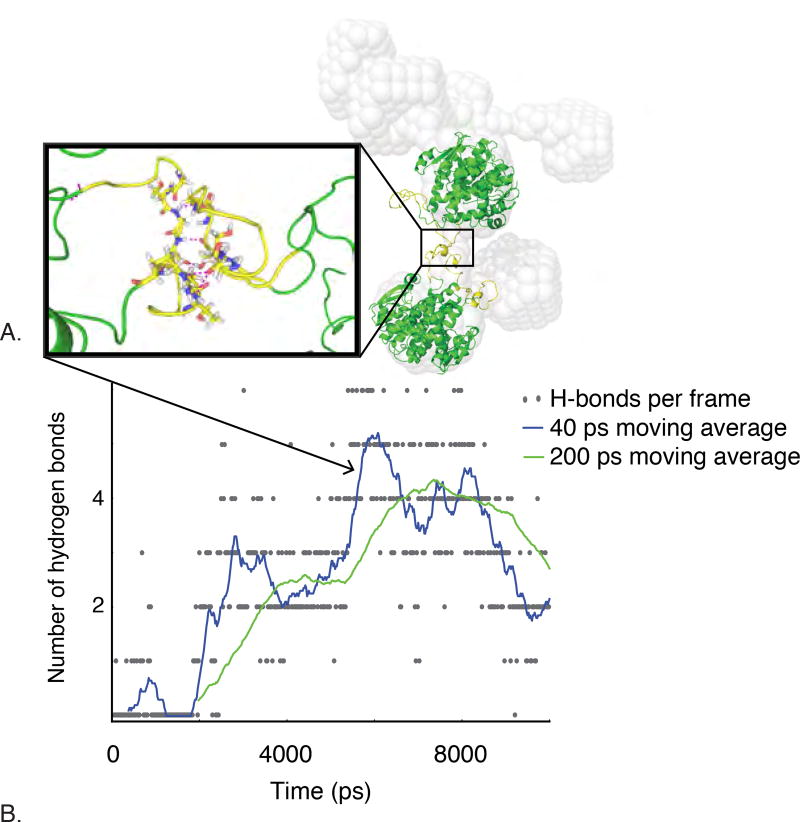
Figure 5.
MD simulation of patch-like loop-loop interaction in low-index regions of the lens. A) Homology models of S-crystallin dimers, shown in green and yellow, with centers of mass positioned according to DAMMIF output, shown in grey. Inset shows the interaction of the two unstructured loops of proteins in this orientation after ~6,000 ps of MD simulation. Hydrogen bonds between the two loops are shown in pink. B) Number of hydrogen bonds between two loops binding together two separate S-crystallin dimers in MD simulation as a function of time. Hydrogen bonds form between the two loops after a few hundred ps and increase to a maximum of six, with a 200-ps moving average of four.

