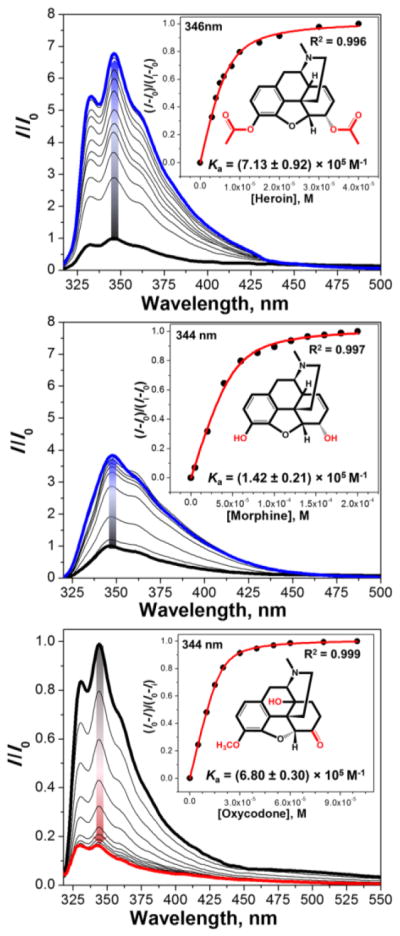
Figure 5.

Fluorescence titration profiles of S2 (3 μM) with opiates in H2O (pH 3, HCl). Top: [heroin] = 0–40 μM, λex = 310 nm; Middle: [morphine] = 0–200 μM, λex = 305 nm; Bottom: [oxycodone] = 0–100 μM, λex= 290 nm; Graph insets show titration isotherms based on the change of fluorescence intensity at max. wavelength.
