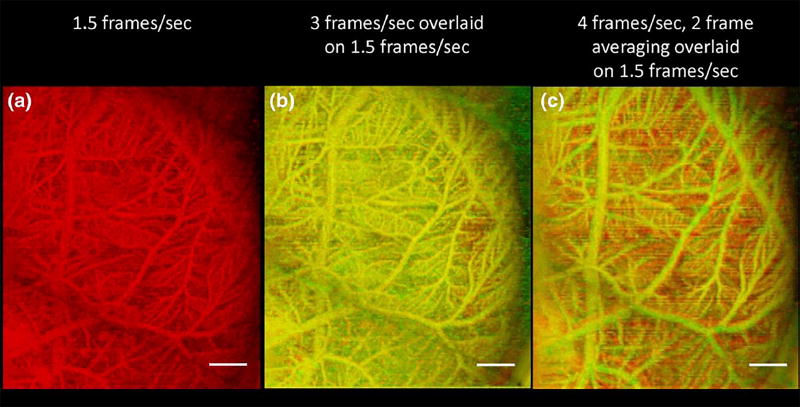
FIGURE 4.
Overlaying images acquired at different rates allows for visualization of resulting differences in which vessels are detected. (a) Maximum intensity projection of chorioallantoic membrane in a chicken embryo acquired at 1.5 frames/s. (b) Overlaid chicken embryo image showing acquisitions at (b) 1.5 frames per second (red) and 3 frames per second (green) indicates isolated locations (shown in red) where the slower frame rate is more sensitive to microbubbles in small vessels, while (c) overlaid acquisitions at 1.5 frames per second (red) and 4 frames per second with 2 frame averaging (green) indicate many locations where the slower frame rate is more sensitive to microbubbles in small vessels. Scale bar indicates 2 mm.

