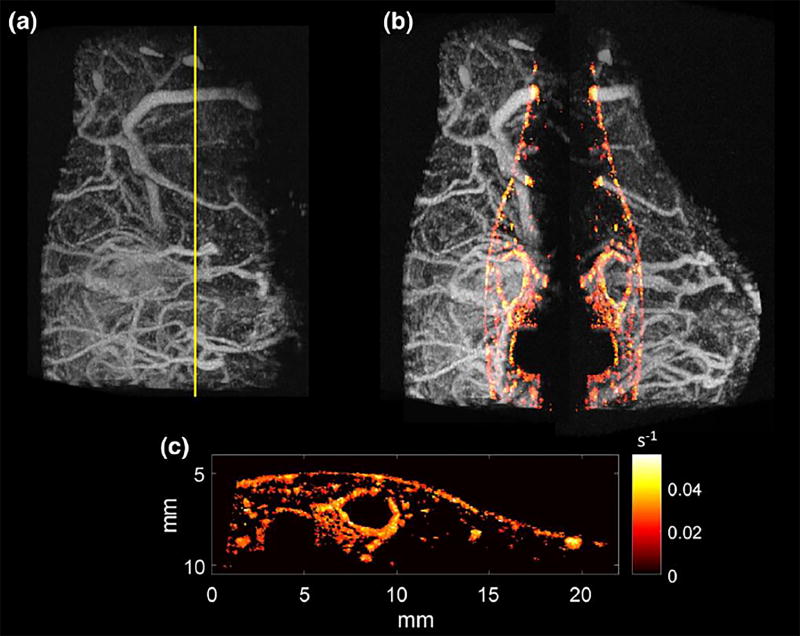
FIGURE 5.
(a) Maximum intensity projection acoustic angiography image acquired in the flank of 12-week-old female C3(1)/Tag mice mouse, with the yellow line indicating the plane in which the perfusion map was acquired. (b) Separated volume with perfusion map overlaid on both sides of volume. (c) Perfusion map alone, with brighter color indicating increased perfusion rate according to the described “time to 20% of peak enhancement” processing.

