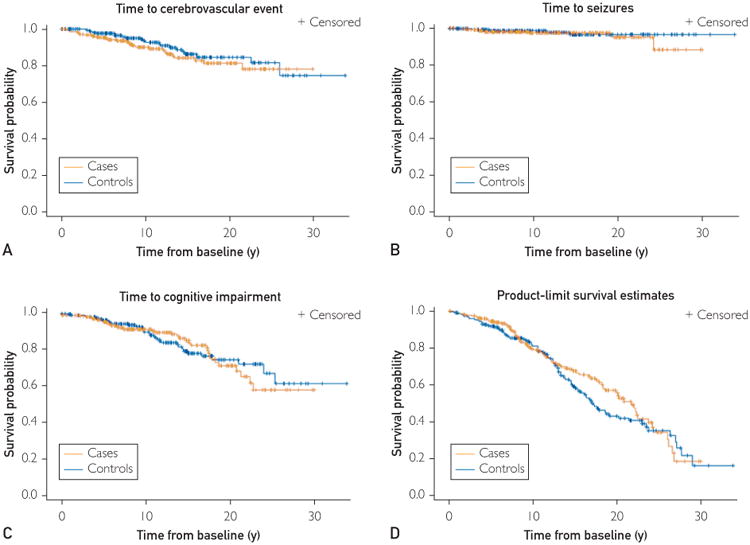
Figure 2.

Kaplan-Meyer plots for events of interest at follow-up. Plots for the time to occurrence of first vascular event (A), seizure (B), diagnosis of cognitive impairment (C), and death (D).

Kaplan-Meyer plots for events of interest at follow-up. Plots for the time to occurrence of first vascular event (A), seizure (B), diagnosis of cognitive impairment (C), and death (D).